Fig. 3
Download original image
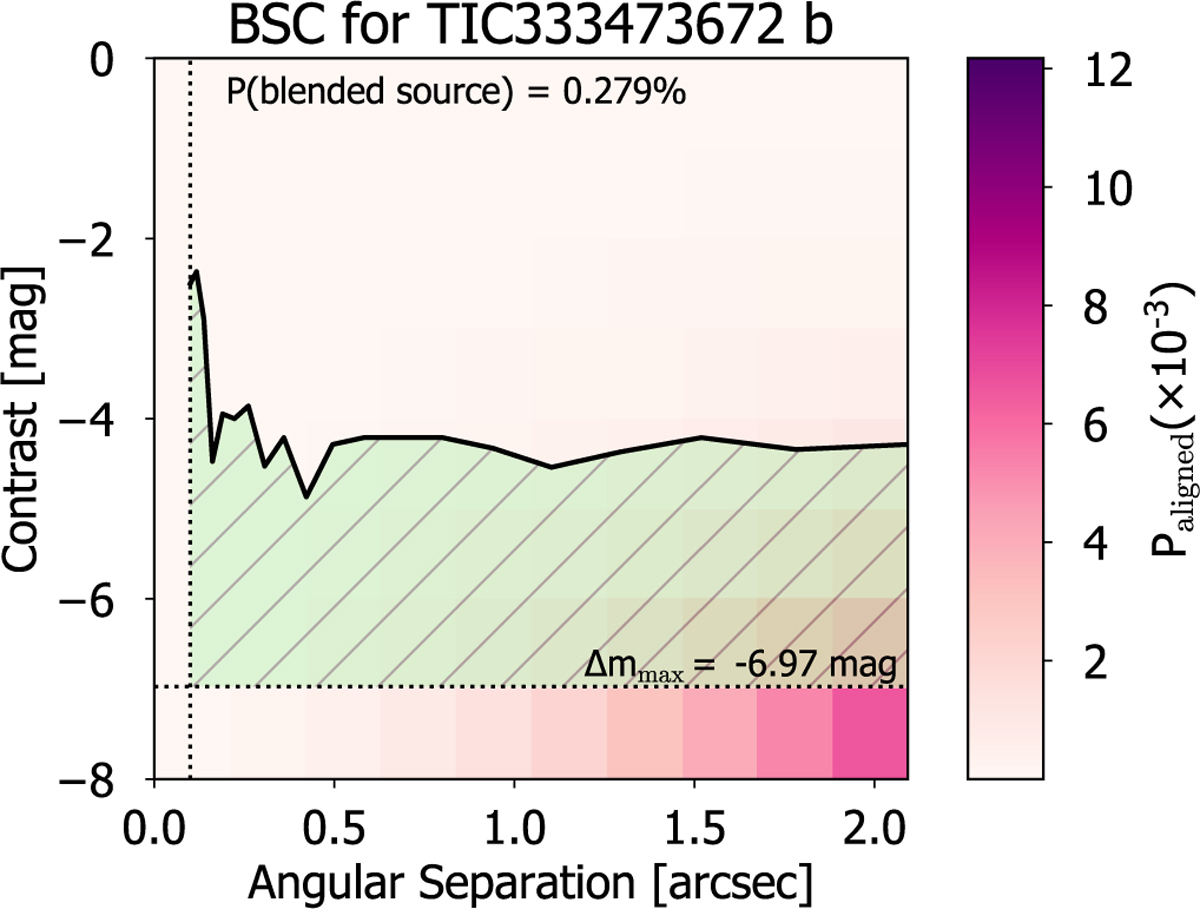
Blended source confidence (BSC) curve from the AstraLux SDSSz image (solid black line). The colour on each angular separation and contrast bin represent the probability of a source aligned at the location of the target, based on the TRILEGAL model. The horizontal dotted line shows the maximum contrast of a blended binary that is capable of imitating the planet’s transit depth. The green region represents the regime that is not explored by the high-spatial resolution image. The BSC curve corresponds to the integration of Paligned over this region.
Current usage metrics show cumulative count of Article Views (full-text article views including HTML views, PDF and ePub downloads, according to the available data) and Abstracts Views on Vision4Press platform.
Data correspond to usage on the plateform after 2015. The current usage metrics is available 48-96 hours after online publication and is updated daily on week days.
Initial download of the metrics may take a while.