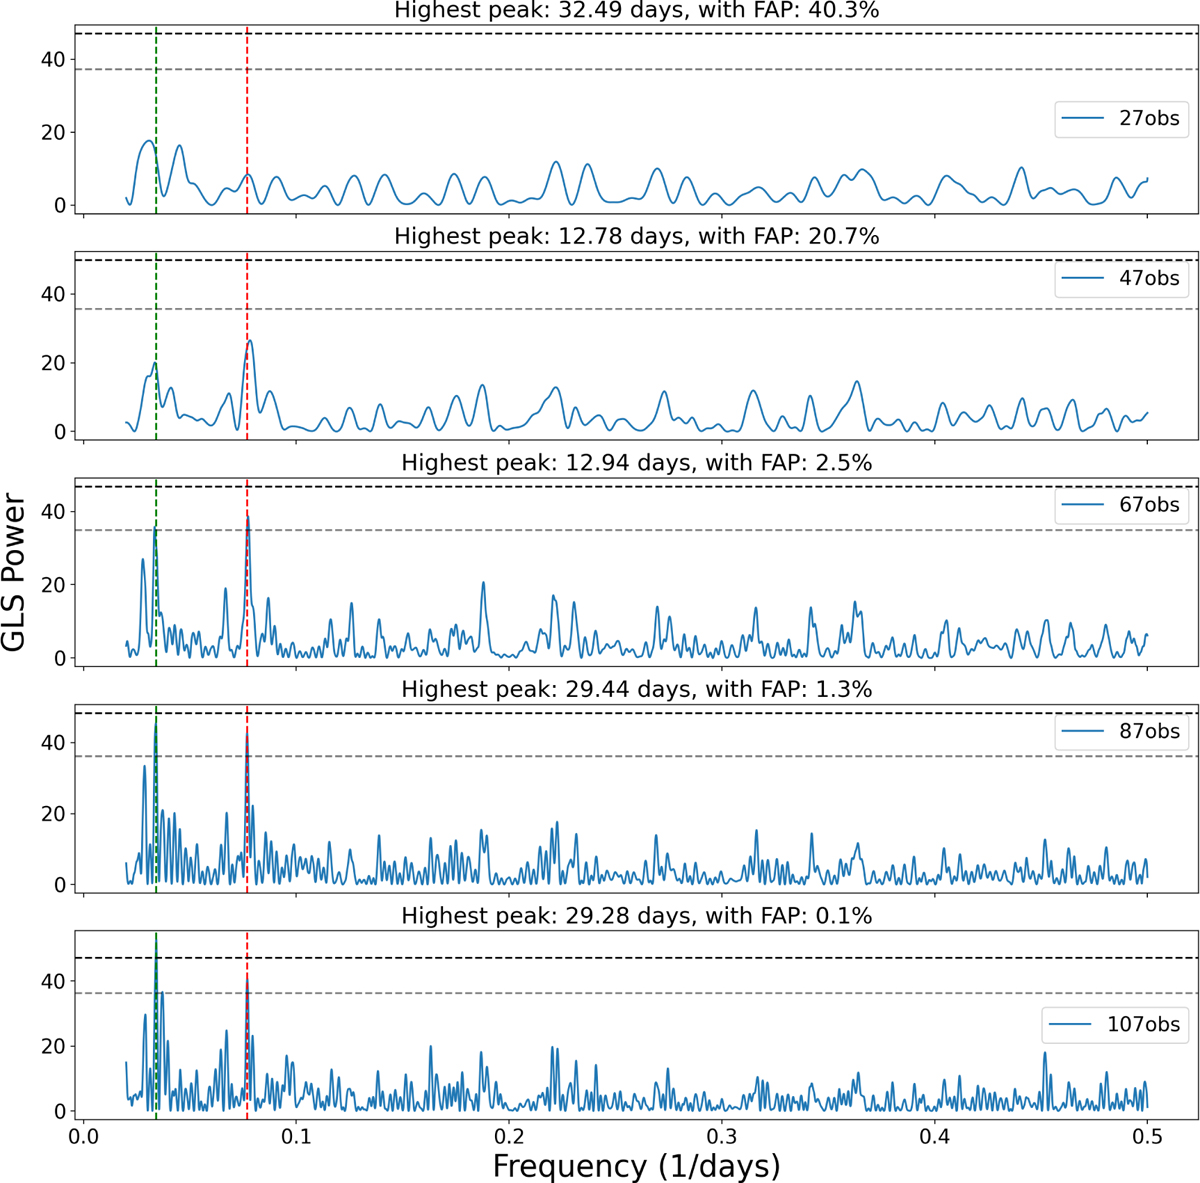
Fig. D.4
Download original image
Unnormalized GLS power for a different number of HARPS-N observations. The power of the 29-day signal increases with more observations. The vertical dashed red and green lines indicate TOI-1422 b and TOI-1422 c orbital periods, respectively, while the horizontal dashed lines signal the 10% and 1% confidence levels, respectively (evaluated with the bootstrap method).
Current usage metrics show cumulative count of Article Views (full-text article views including HTML views, PDF and ePub downloads, according to the available data) and Abstracts Views on Vision4Press platform.
Data correspond to usage on the plateform after 2015. The current usage metrics is available 48-96 hours after online publication and is updated daily on week days.
Initial download of the metrics may take a while.