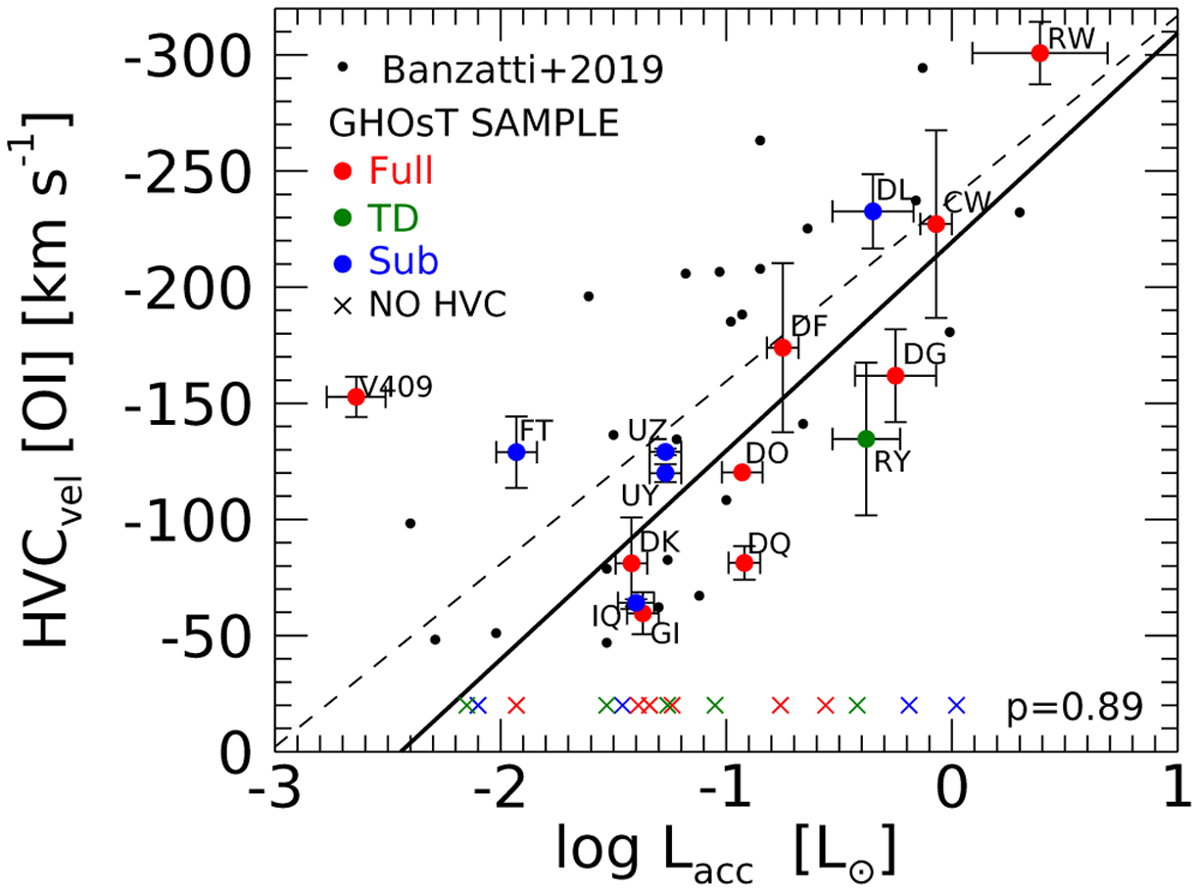
Fig. 9
Download original image
Deprojected [O i]630nm HVC peak velocities as a function of Lacc for the GHOsT subsample driving jets (colored points) compared with a CTTs sample reported in Banzatti et al. (2019; black points). A fit to both data samples is shown as the dashed black line (Banzatti et al. 2019 sample) and as the continuous black line (GHOsT sample). The latter was computed by excluding the outliers (V409 Tau and FT Tau). The Pearson coefficient for the GHOsT distribution is labeled in the figure.
Current usage metrics show cumulative count of Article Views (full-text article views including HTML views, PDF and ePub downloads, according to the available data) and Abstracts Views on Vision4Press platform.
Data correspond to usage on the plateform after 2015. The current usage metrics is available 48-96 hours after online publication and is updated daily on week days.
Initial download of the metrics may take a while.