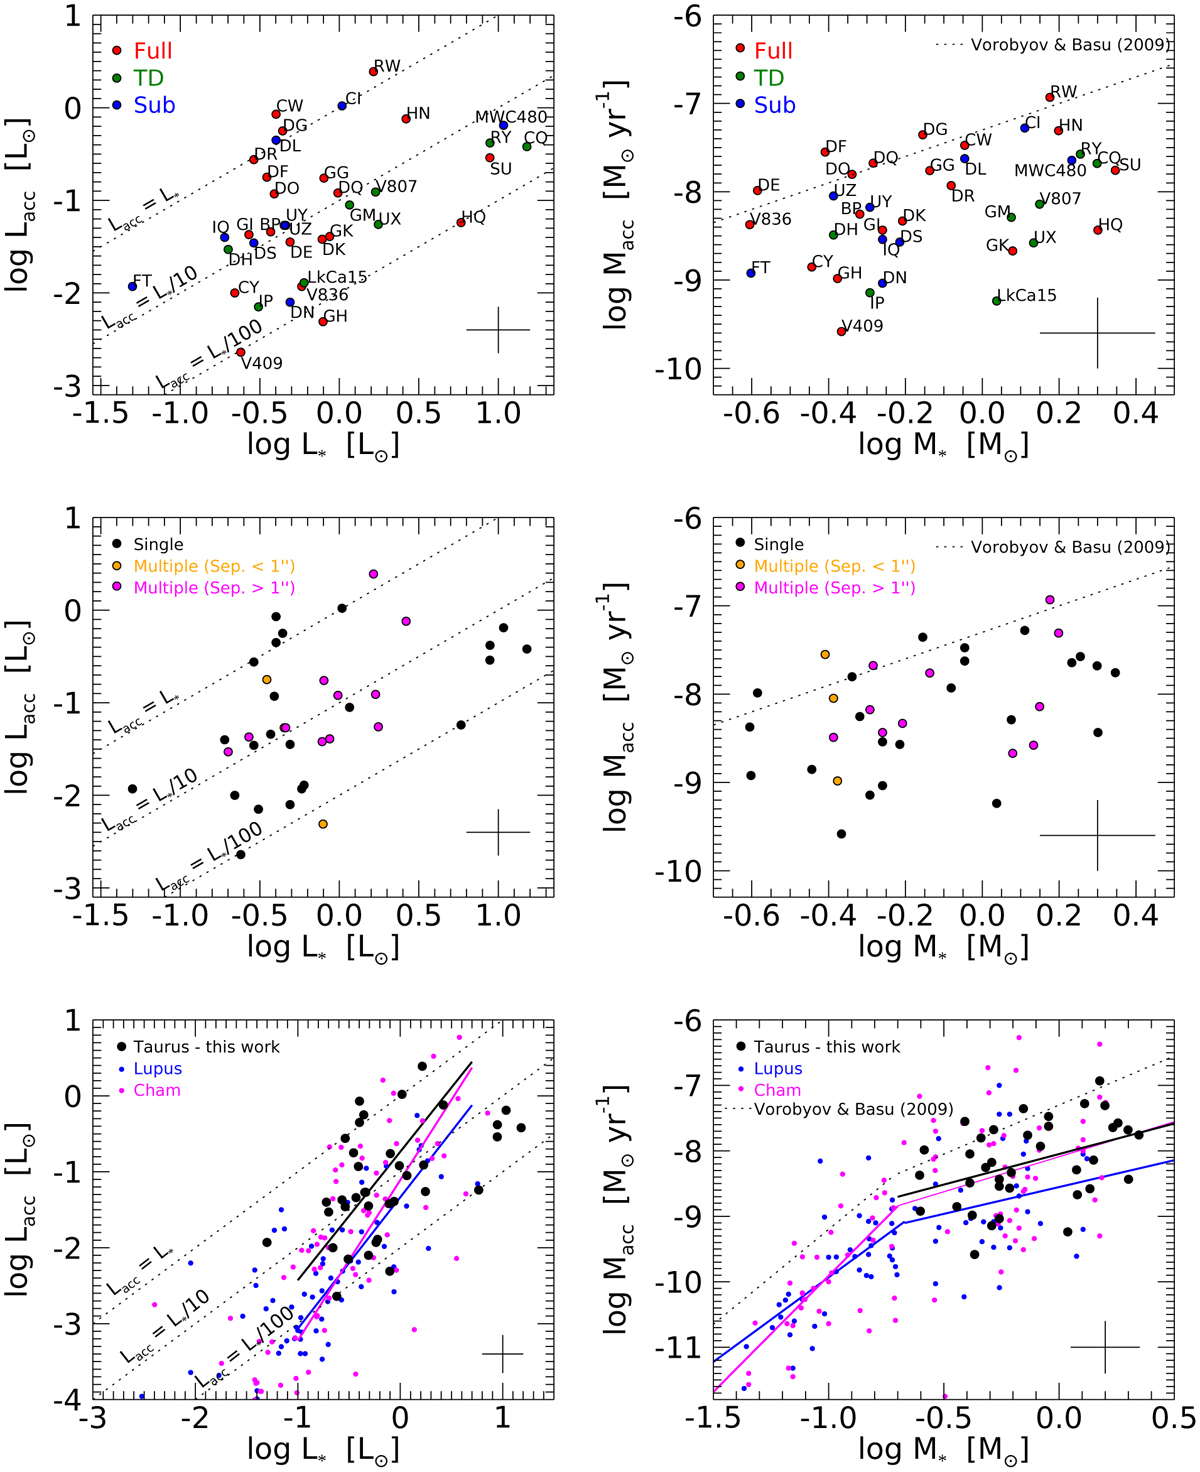
Fig. 6
Download original image
Accretion luminosity as a function of stellar luminosity (left column) and mass accretion rate as a function of stellar mass (right column) for the Taurus sample (large circles). In the top panels the symbols are distinguished according to the disk structure and in the lower panels the symbols are allotted according to the multiplicity. The bottom panels provide a comparison with Lupus (blue) and Chamaeleon I (magenta). Solid lines are the best fit to data of the same color. The average errors for the Taurus sample are drawn in the lower corner.
Current usage metrics show cumulative count of Article Views (full-text article views including HTML views, PDF and ePub downloads, according to the available data) and Abstracts Views on Vision4Press platform.
Data correspond to usage on the plateform after 2015. The current usage metrics is available 48-96 hours after online publication and is updated daily on week days.
Initial download of the metrics may take a while.