Fig. 4
Download original image
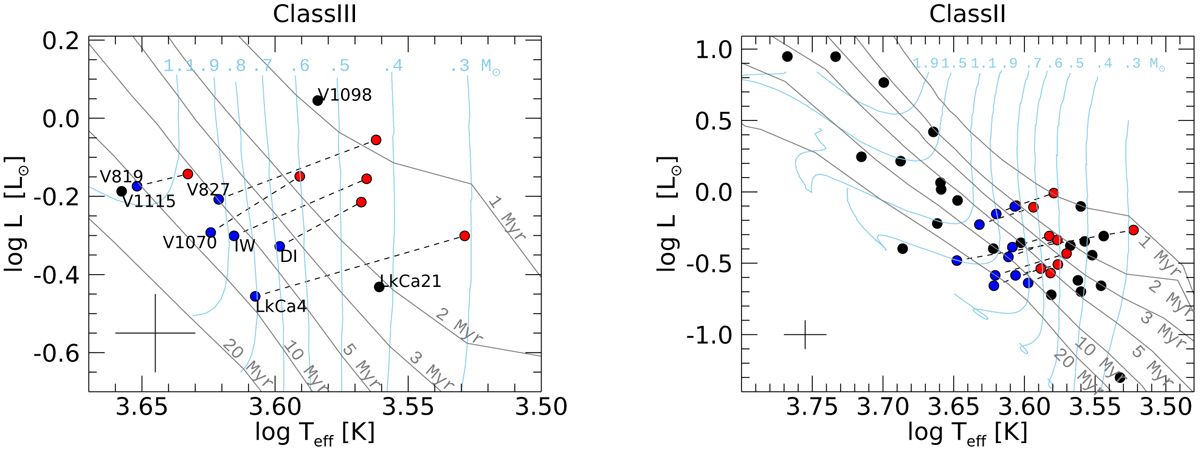
Hertzprung-Russel diagram of class III sources (left) and class II sources (right), with evolutionary tracks by Siess et al. (2000). The isochrones are for ages of 1, 2, 3, 5, 10, and 20 Myr. Positions of heavily spotted sources with Tff and L* based on the 2 Teff fit are shown as red points, and those obtained assuming a single temperature based on many optical spectral features are shown as blue points. Positions of sources without evidence of spots are shown as black points. The average errors are drawn in the bottom left of each panel.
Current usage metrics show cumulative count of Article Views (full-text article views including HTML views, PDF and ePub downloads, according to the available data) and Abstracts Views on Vision4Press platform.
Data correspond to usage on the plateform after 2015. The current usage metrics is available 48-96 hours after online publication and is updated daily on week days.
Initial download of the metrics may take a while.