Fig. 2
Download original image
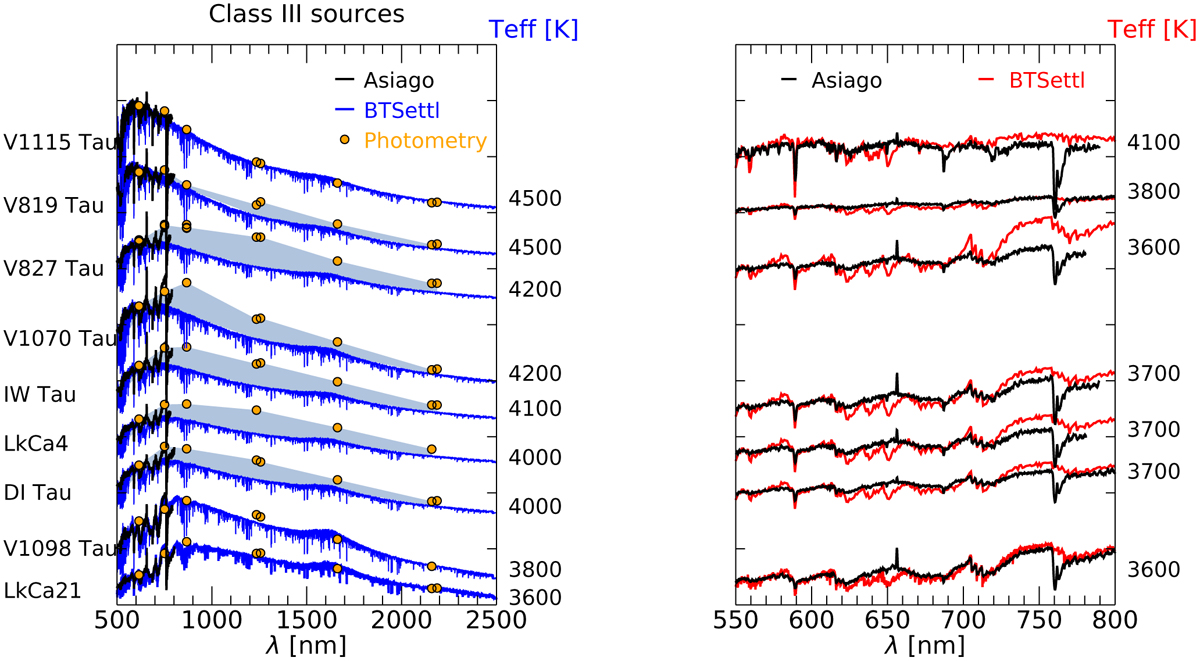
Comparison between observed spectra of the class III sample and their respective BTSettl models. Left: extinction-corrected Asiago spectra (black) with contemporaneous photometry (orange points). BTSettl models corresponding to the optical Teff are shown in blue. The filled light blue regions highlight the NIR flux that is underestimated by the models. Right: as in the left panel but assuming Av = 0 and BTSettl models corresponding to the Teff measured from NIR high-resolution spectra (López-Valdivia et al. 2021). Source names and Teff are labeled for each spectrum.
Current usage metrics show cumulative count of Article Views (full-text article views including HTML views, PDF and ePub downloads, according to the available data) and Abstracts Views on Vision4Press platform.
Data correspond to usage on the plateform after 2015. The current usage metrics is available 48-96 hours after online publication and is updated daily on week days.
Initial download of the metrics may take a while.