Open Access
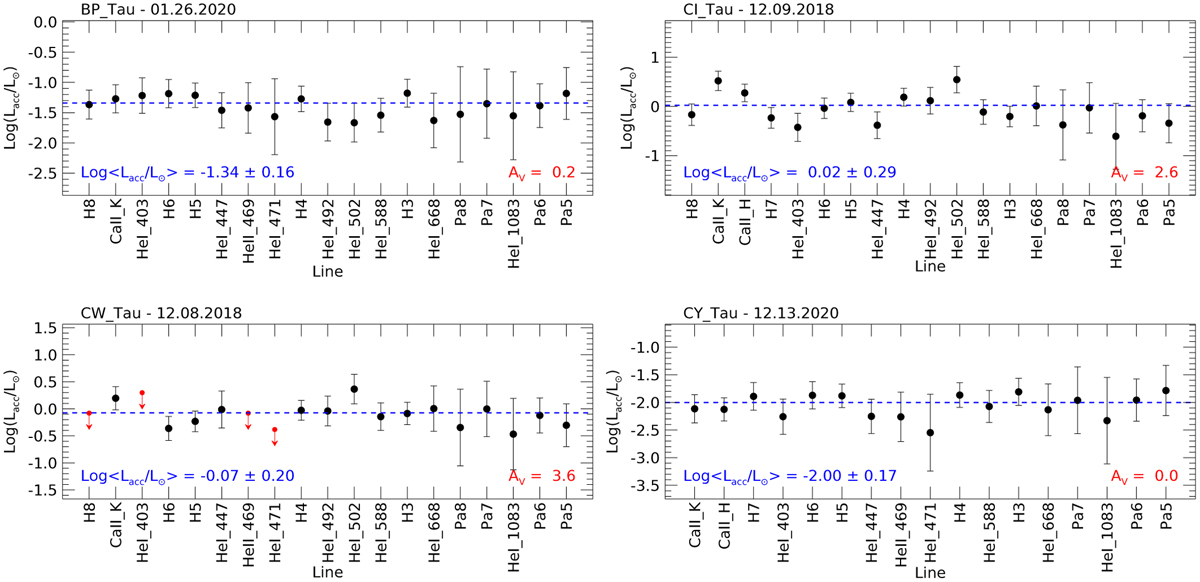
Fig. B.4
Download original image
Plots of Lacc as a function of the different accretion diagnostics. The dashed horizontal blue line represents the median 〈Lacc〉. Upper limits for nondetected lines are indicated with red arrows. For each panel, the target name, the observation date (MM.DD.YYYY), and the computed 〈Lacc〉 and Av are also labeled.
This figure is made of several images, please see below:
Current usage metrics show cumulative count of Article Views (full-text article views including HTML views, PDF and ePub downloads, according to the available data) and Abstracts Views on Vision4Press platform.
Data correspond to usage on the plateform after 2015. The current usage metrics is available 48-96 hours after online publication and is updated daily on week days.
Initial download of the metrics may take a while.