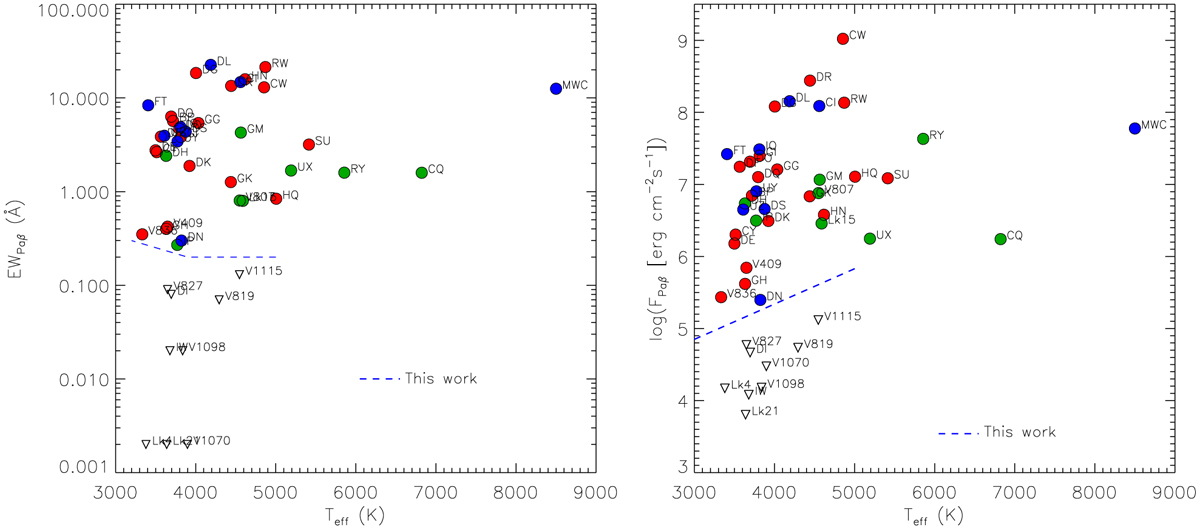
Fig. A.2
Download original image
Left: Paβ equivalent width versus vs Teff for class II (filled dots) and class III (open symbols) objects (colors as in Fig. A.1). Class III targets are shown as downward triangles because their measurements of EWs (and fluxes) in Paβ are upper limits. The dashed line separates class II from class III objects, as empirically defined in this work. Right: Paβ flux vs Teff for the same objects (symbols as in the left panel). The dashed straight line, defined in this work, is shown to follow the upper envelope of the sources without accretion; this line was drawn as having the same slope of the Frasca et al. (2015) empirical relation found for the Hα line (see the right panel of Fig. A.1).
Current usage metrics show cumulative count of Article Views (full-text article views including HTML views, PDF and ePub downloads, according to the available data) and Abstracts Views on Vision4Press platform.
Data correspond to usage on the plateform after 2015. The current usage metrics is available 48-96 hours after online publication and is updated daily on week days.
Initial download of the metrics may take a while.