Fig. 12
Download original image
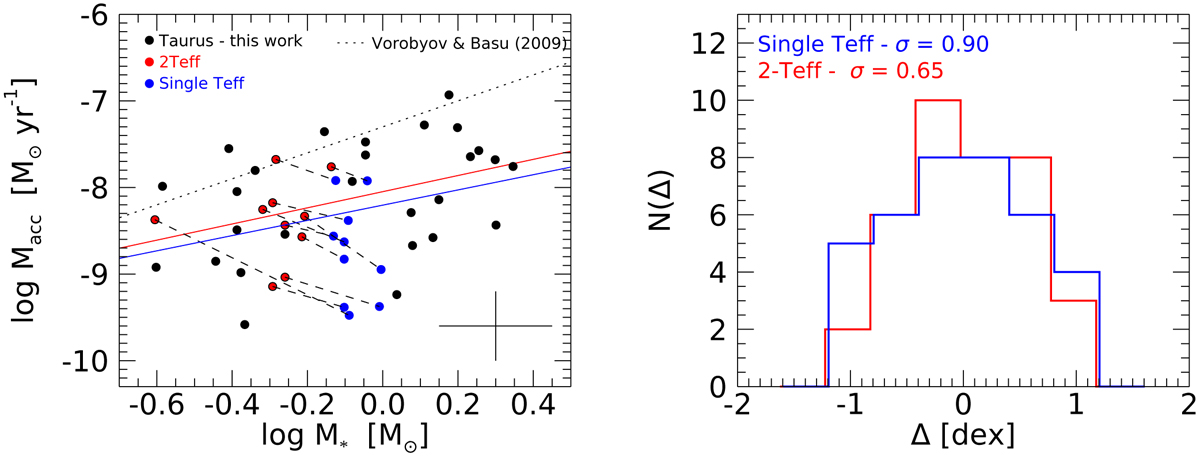
Left: as in Fig. 11, but for mass accretion rate and stellar mass. Differences between the two methods affect the ![]() and M* directions. Fits to the black and red distributions and black and blue distributions are shown as solid red and blue lines, respectively. Right: Distribution of the dispersion from the individual best-fitting Macc − M* relation considering the total sample with the 2 Teff (red) and the single Teff (blue) modeling for the spotted source. The dispersion of the distributions is labeled in the panel.
and M* directions. Fits to the black and red distributions and black and blue distributions are shown as solid red and blue lines, respectively. Right: Distribution of the dispersion from the individual best-fitting Macc − M* relation considering the total sample with the 2 Teff (red) and the single Teff (blue) modeling for the spotted source. The dispersion of the distributions is labeled in the panel.
Current usage metrics show cumulative count of Article Views (full-text article views including HTML views, PDF and ePub downloads, according to the available data) and Abstracts Views on Vision4Press platform.
Data correspond to usage on the plateform after 2015. The current usage metrics is available 48-96 hours after online publication and is updated daily on week days.
Initial download of the metrics may take a while.