Fig. 10
Download original image
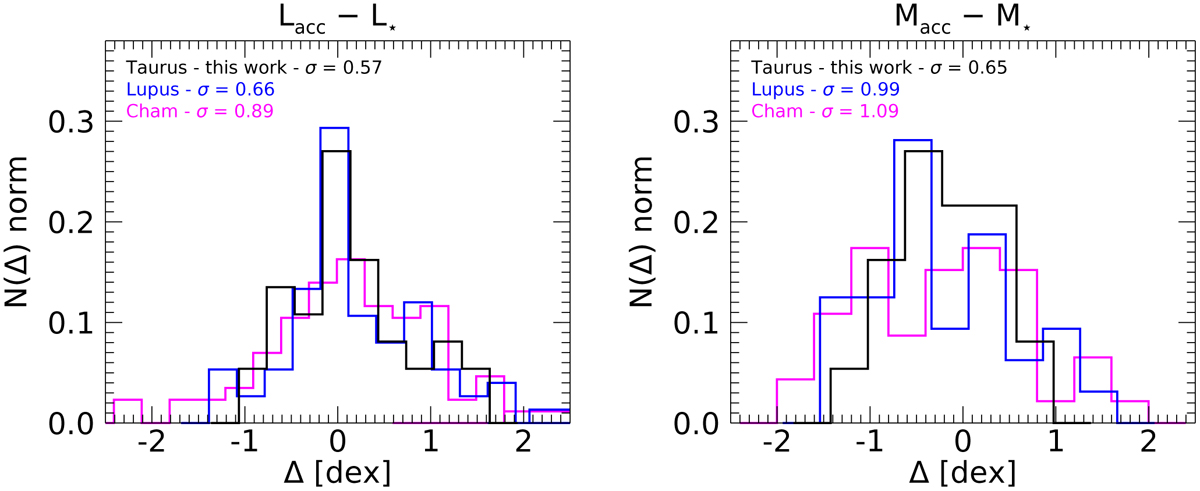
Normalized distribution of the residuals from the best-fitting Lacc − L* (left panel) and ![]() (right panel) relation, computed within the same L* and M* ranges as were probed with the GHOsT data. In black we show the distribution for the Taurus sample, and the distributions of Lupus and Chamaeleon I are reported in blue and magenta, respectively. The spread of the distributions is labeled in the panels. They are computed as the 1σ of the Gaussian fits to the distributions.
(right panel) relation, computed within the same L* and M* ranges as were probed with the GHOsT data. In black we show the distribution for the Taurus sample, and the distributions of Lupus and Chamaeleon I are reported in blue and magenta, respectively. The spread of the distributions is labeled in the panels. They are computed as the 1σ of the Gaussian fits to the distributions.
Current usage metrics show cumulative count of Article Views (full-text article views including HTML views, PDF and ePub downloads, according to the available data) and Abstracts Views on Vision4Press platform.
Data correspond to usage on the plateform after 2015. The current usage metrics is available 48-96 hours after online publication and is updated daily on week days.
Initial download of the metrics may take a while.