Fig. 3.
Download original image
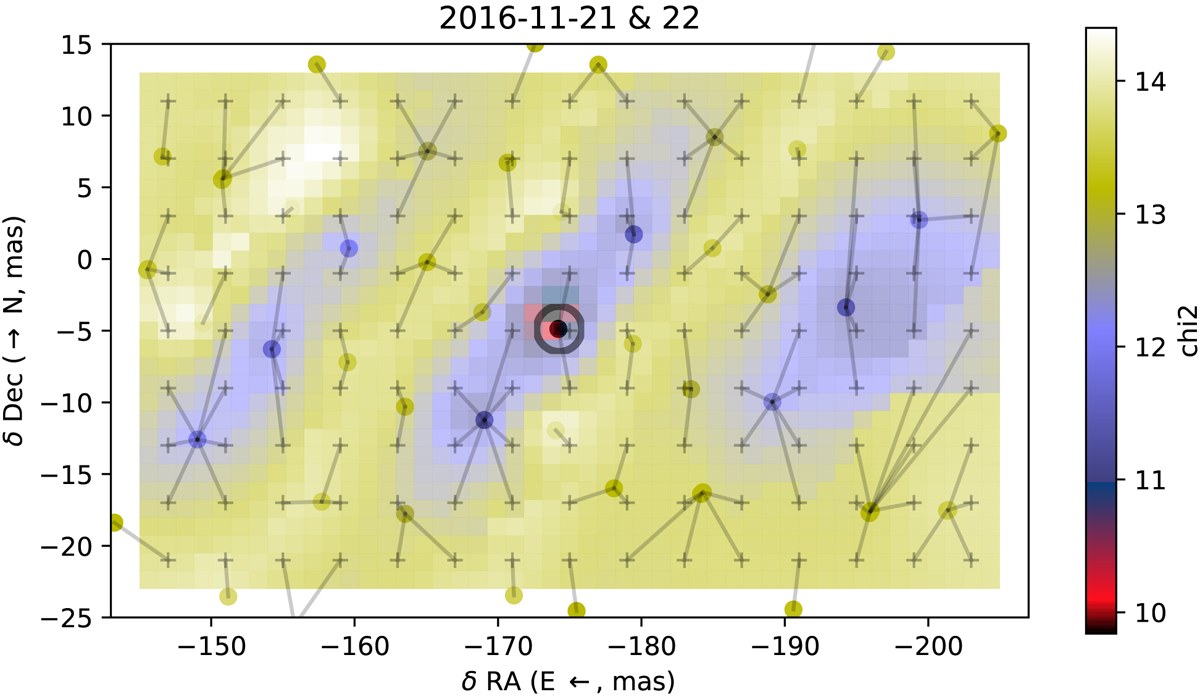
Map of the χ2 minimization fit to the GRAVITY observations of 21−22 November 2016 using the PMOIRED algorithm. The explored angular separation (δRA, δDec) represents the position of Achernar B relative to A. The starting positions of the χ2 minimum searches are marked with gray “+” symbols. The best-fit position is marked with a circle close to the center of the diagram.
Current usage metrics show cumulative count of Article Views (full-text article views including HTML views, PDF and ePub downloads, according to the available data) and Abstracts Views on Vision4Press platform.
Data correspond to usage on the plateform after 2015. The current usage metrics is available 48-96 hours after online publication and is updated daily on week days.
Initial download of the metrics may take a while.