Fig. C.2.
Download original image
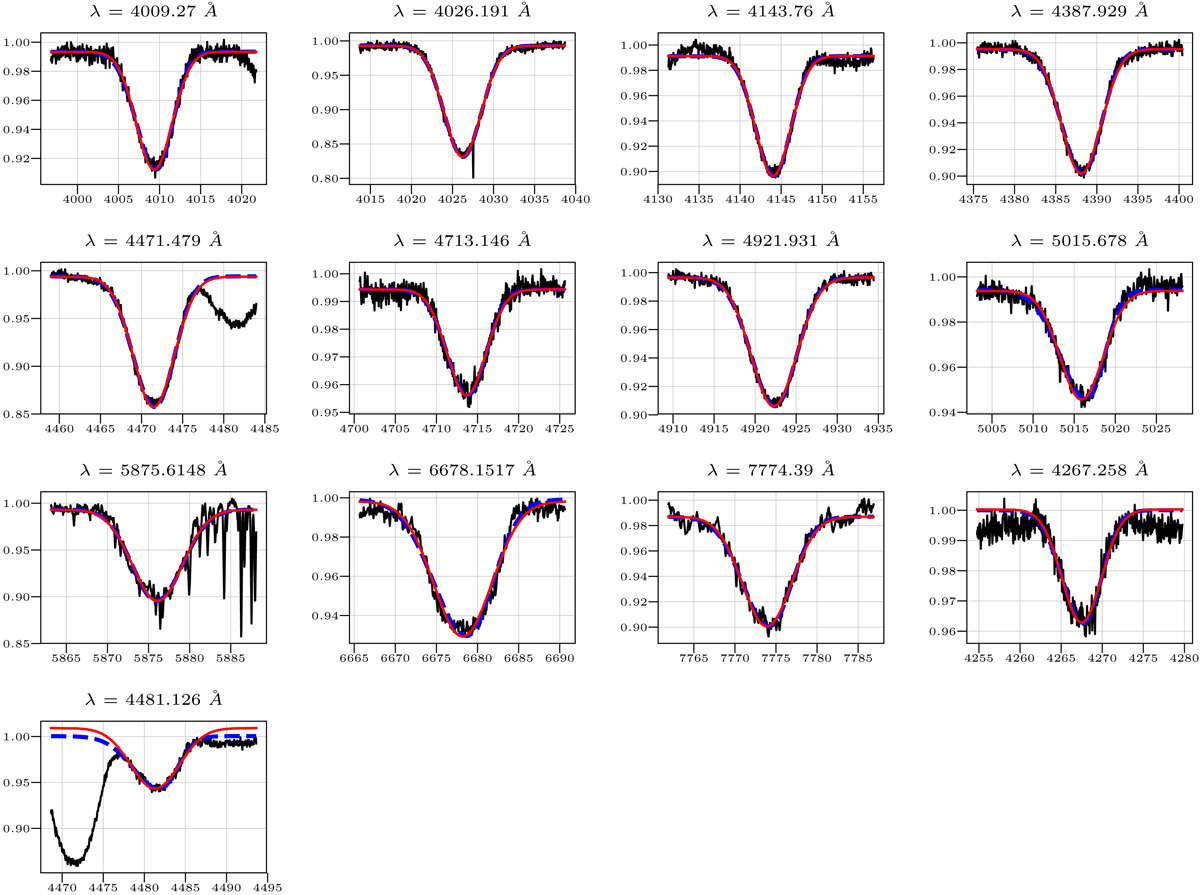
Significant photospheric absorption lines of Achernar A, taken from a 2006 FEROS stacked spectrum (see text). For each displayed line, the stacked spectrum is displayed in black, a Gaussian fit of the line is displayed as a red solid curve, and a biGaussian fit of the line is displayed as a blue dashed curve. The vertical axis is the ratio of the flux to the continuum, and the horizontal axes the wavelength in Å.
Current usage metrics show cumulative count of Article Views (full-text article views including HTML views, PDF and ePub downloads, according to the available data) and Abstracts Views on Vision4Press platform.
Data correspond to usage on the plateform after 2015. The current usage metrics is available 48-96 hours after online publication and is updated daily on week days.
Initial download of the metrics may take a while.