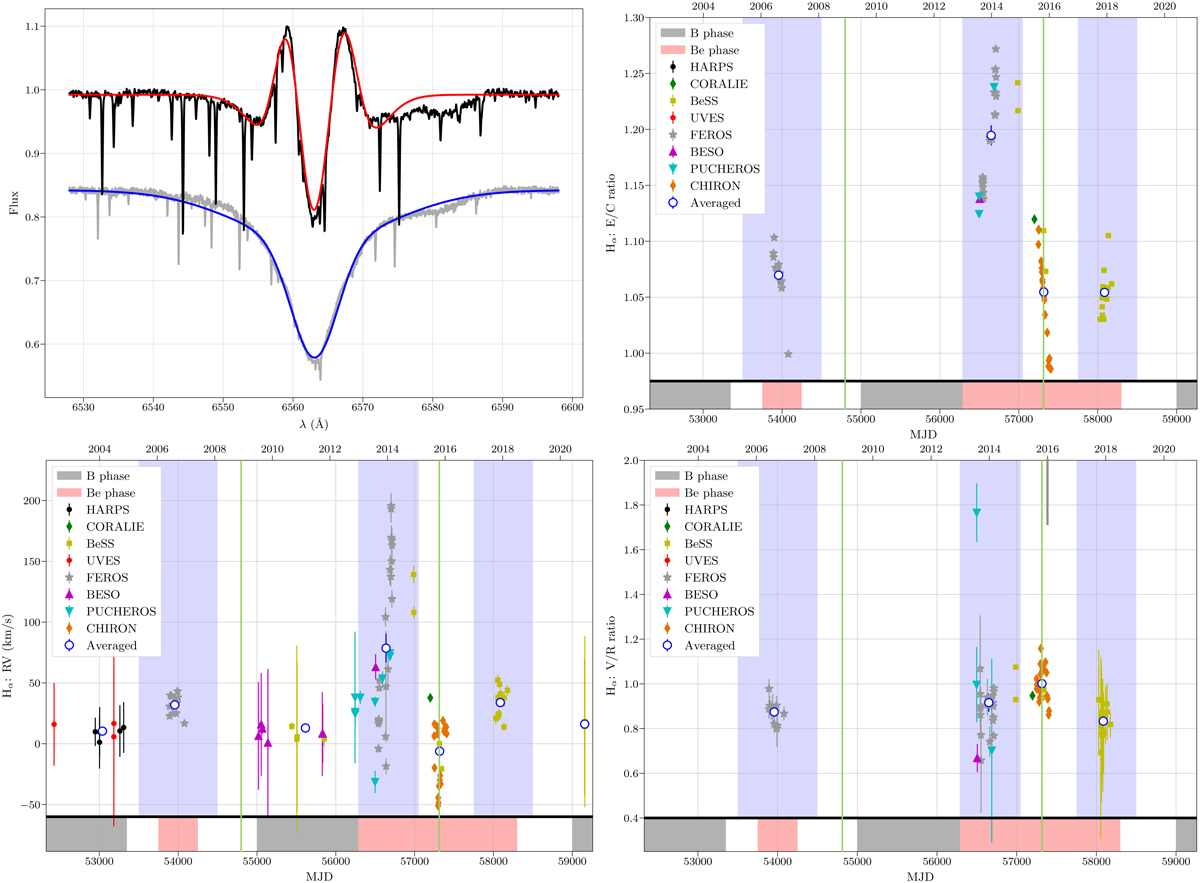
Fig. C.1.

Download original image
Variability of Achernar in the Hα line. The Hα line is displayed in the top left panel for the two cases: the emission, Be phase (2006 FEROS spectrum, upper black), and the quiescent, B phase (2003 HARPS spectrum, lower gray, flux-shifted for clarity). Empiric line models are displayed as the red and blue curves, respectively (see text). The three other panels display the time series of the observables derived from the Hα line modeling (from left to right and top to bottom): the E/C ratio, the Hα line RV, and the V/R ratio. At the bottom of each panel, observed emission and quiescent phases are highlighted in red and gray, respectively. The periastron passages at epochs 2008.78 and 2015.81 are marked with green vertical lines. Open blue circles represent data values averaged over large time intervals, highlighted in blue or white in the background.
Current usage metrics show cumulative count of Article Views (full-text article views including HTML views, PDF and ePub downloads, according to the available data) and Abstracts Views on Vision4Press platform.
Data correspond to usage on the plateform after 2015. The current usage metrics is available 48-96 hours after online publication and is updated daily on week days.
Initial download of the metrics may take a while.


