Open Access
Fig. 2.
Download original image
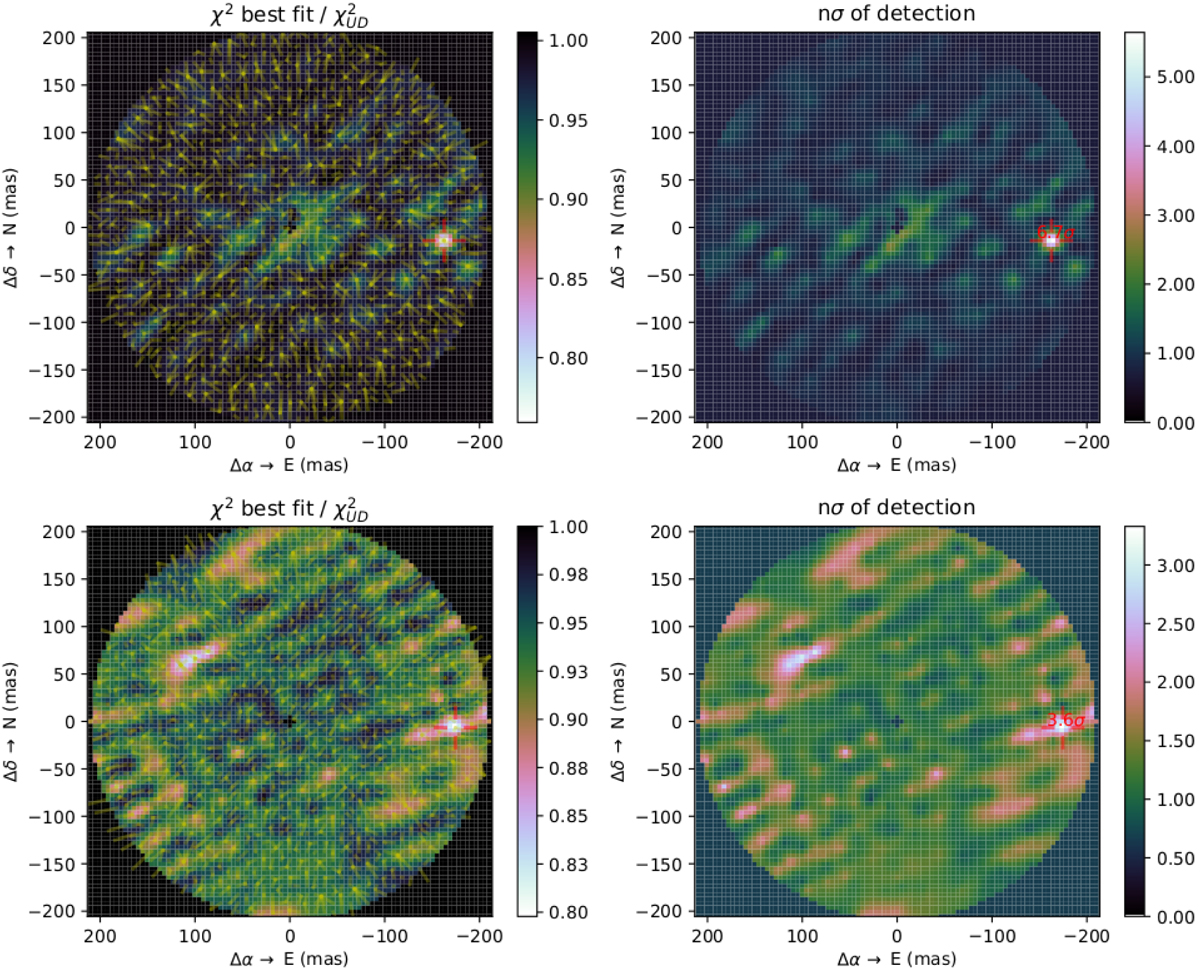
Detection of Achernar B from PIONIER observations with CANDID. Left and right panels: ![]() maps of local minima and detection level maps, respectively, derived with CANDID from our PIONIER 2016 observations. Top panels: correspond to the October 2016 epoch and the bottom panels to the November 2016 epoch.
maps of local minima and detection level maps, respectively, derived with CANDID from our PIONIER 2016 observations. Top panels: correspond to the October 2016 epoch and the bottom panels to the November 2016 epoch.
Current usage metrics show cumulative count of Article Views (full-text article views including HTML views, PDF and ePub downloads, according to the available data) and Abstracts Views on Vision4Press platform.
Data correspond to usage on the plateform after 2015. The current usage metrics is available 48-96 hours after online publication and is updated daily on week days.
Initial download of the metrics may take a while.