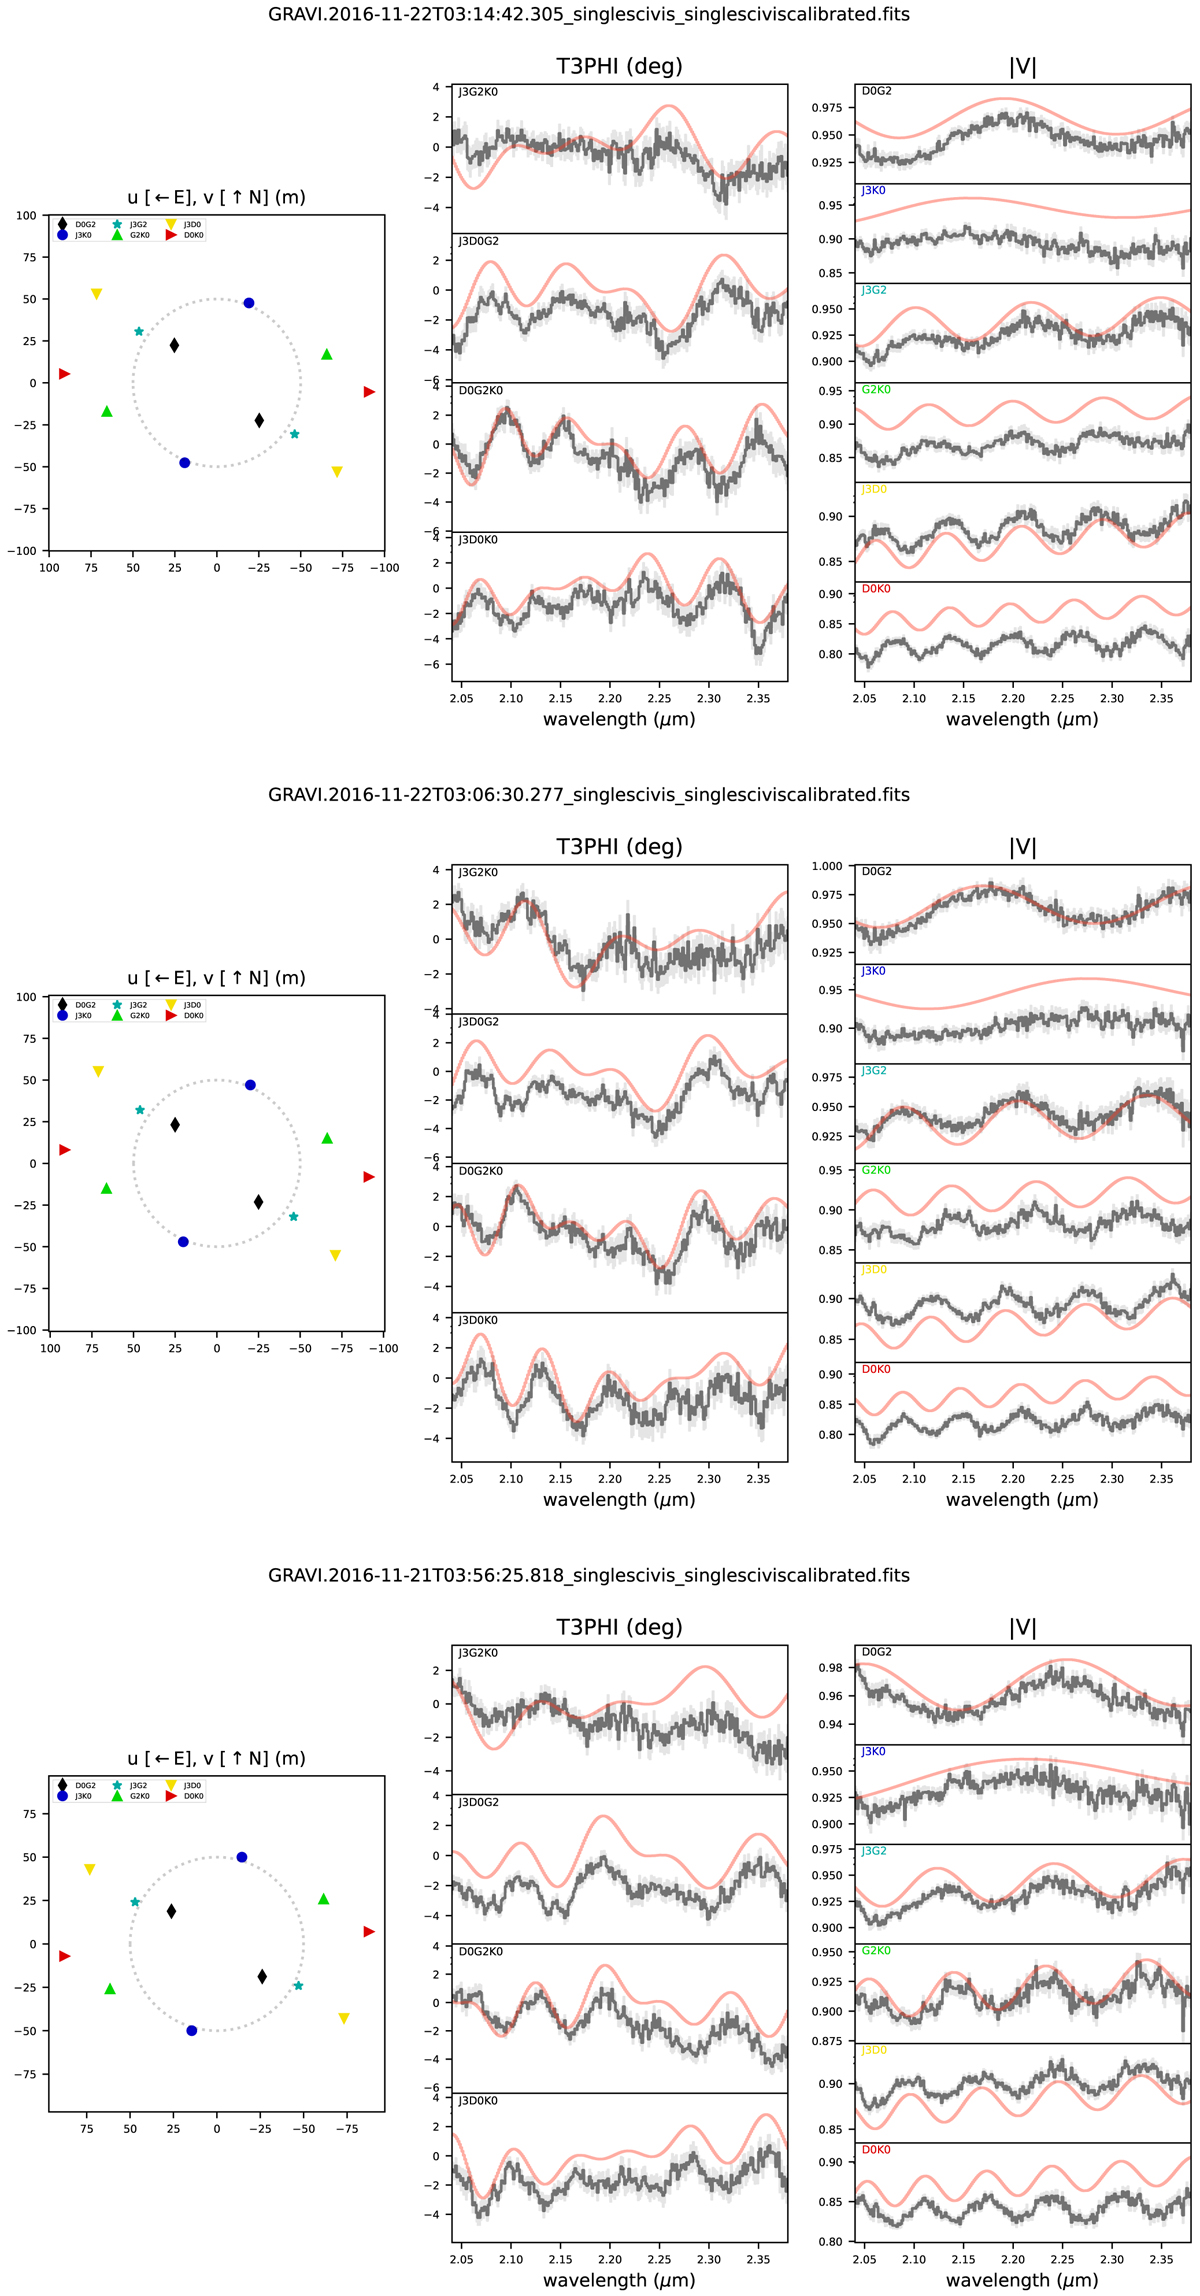
Fig. B.1.
Download original image
Detection of Achernar B from the GRAVITY individual observations in the closure phase signal T3ϕ for each of the four telescope triplets, and amplitude of the fringe visibility |V| for the six baselines. The observations are shown as black curves, and the best-fit model as red curves. The observing dates are given above each panel (see also Fig. 4 and Sect. 2.6 for further details).
Current usage metrics show cumulative count of Article Views (full-text article views including HTML views, PDF and ePub downloads, according to the available data) and Abstracts Views on Vision4Press platform.
Data correspond to usage on the plateform after 2015. The current usage metrics is available 48-96 hours after online publication and is updated daily on week days.
Initial download of the metrics may take a while.