Fig. 12.
Download original image
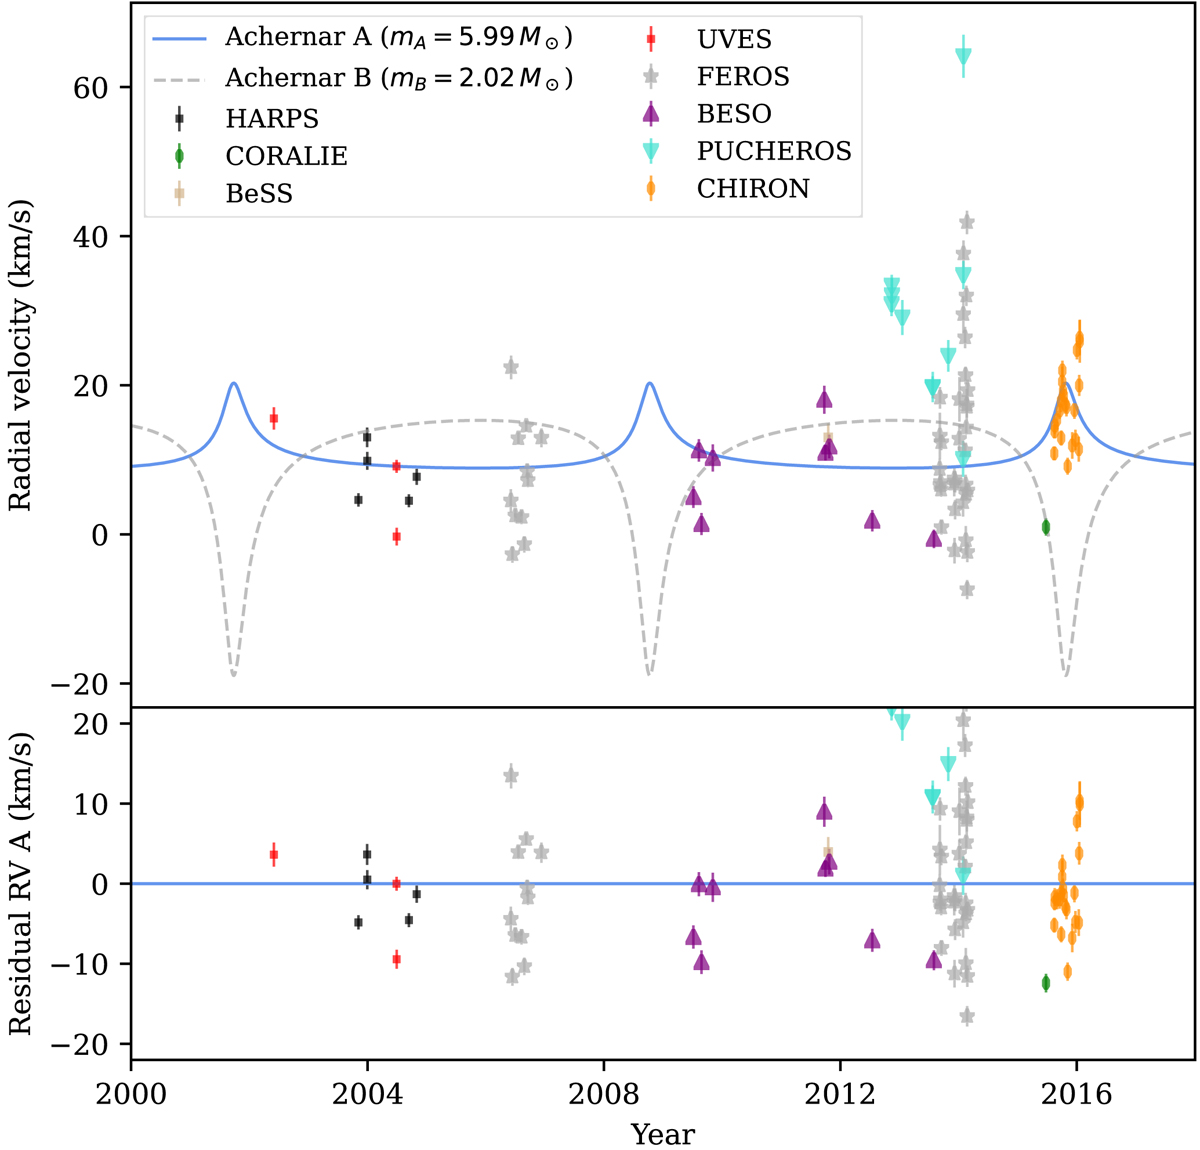
Radial velocity measurements of Achernar A compared to the best-fit orbital model of the AB pair (top panel) and the corresponding residuals (bottom panel). The short-period oscillations (Sect. 2.8.3) with a period of 1.29 day have been subtracted from the measurements. The dashed curve represents the predicted radial velocity curve of Achernar B.
Current usage metrics show cumulative count of Article Views (full-text article views including HTML views, PDF and ePub downloads, according to the available data) and Abstracts Views on Vision4Press platform.
Data correspond to usage on the plateform after 2015. The current usage metrics is available 48-96 hours after online publication and is updated daily on week days.
Initial download of the metrics may take a while.