Fig. 10.
Download original image
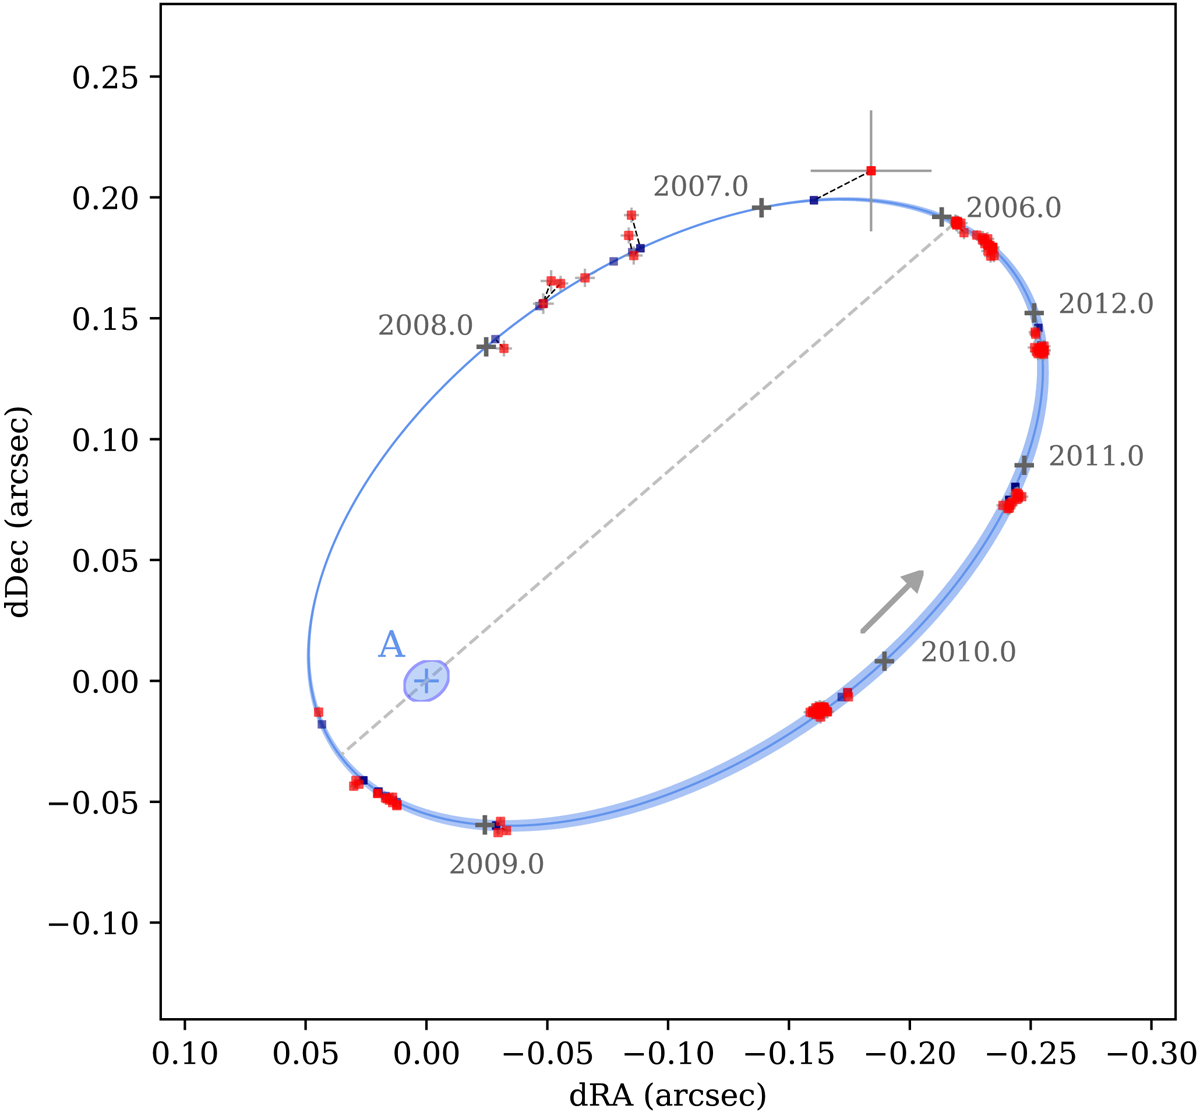
Best-fit relative orbit of Achernar B around A. The measurements are shown with red dots, and the corresponding model positions as dark gray dots (linked with dashed lines). The line of nodes is represented with a gray dashed segment. The thicker part of the orbital trajectory represents the section when Achernar B is closer to us than Achernar A. The rotationally flattened profile of the photosphere of Achernar A is represented enlarged by a factor ten.
Current usage metrics show cumulative count of Article Views (full-text article views including HTML views, PDF and ePub downloads, according to the available data) and Abstracts Views on Vision4Press platform.
Data correspond to usage on the plateform after 2015. The current usage metrics is available 48-96 hours after online publication and is updated daily on week days.
Initial download of the metrics may take a while.