Fig. 1.
Download original image
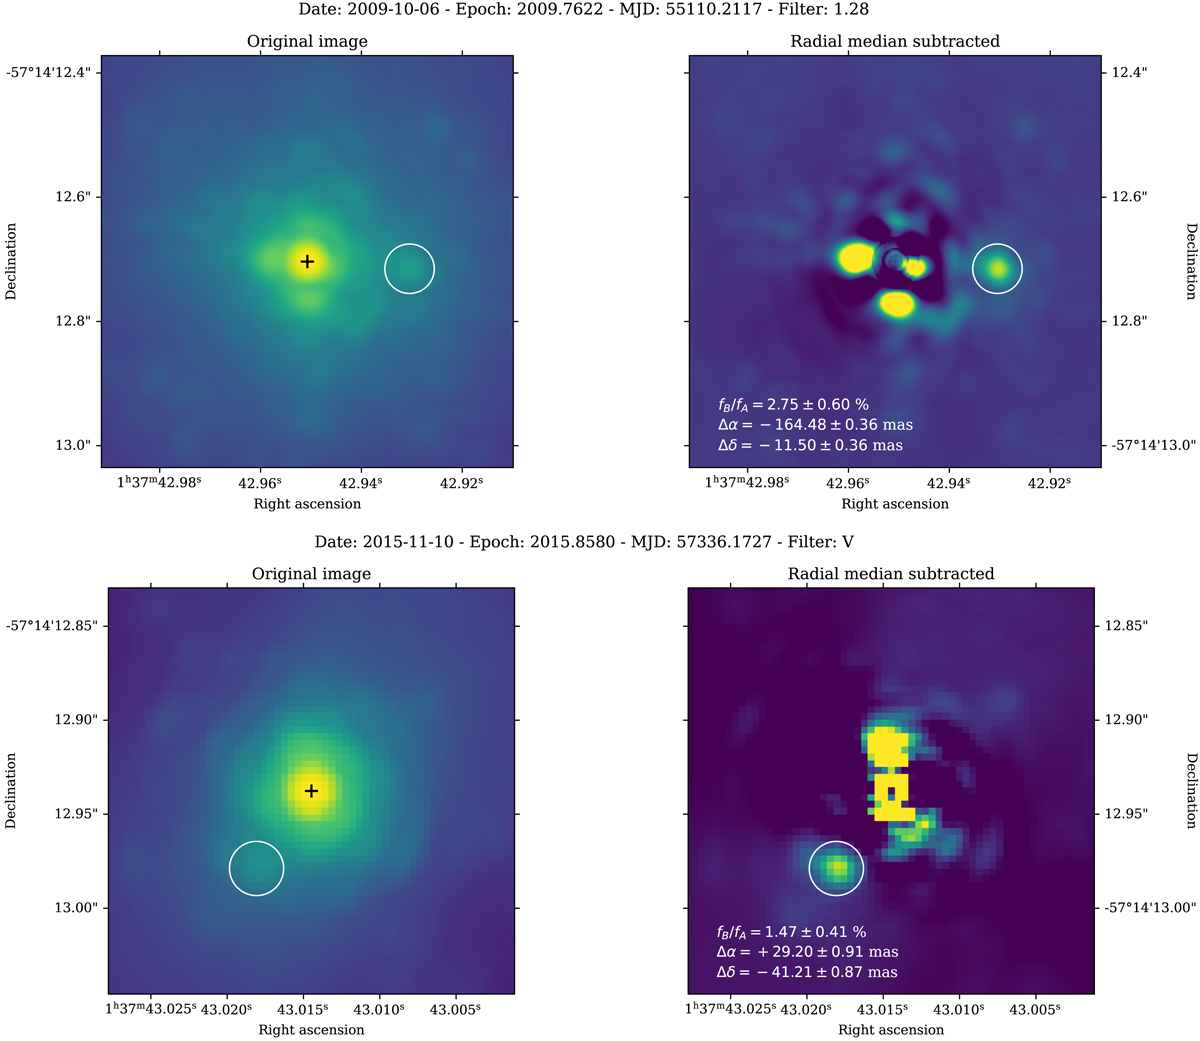
Sample NACO 1.28 μm (top row) and SPHERE/ZIMPOL V band (bottom row) images of Achernar A and B. The panels show both stars with A centered in the field of view and a logarithmic intensity scale. The right images show the result of the subtraction of the radial median profile of the left image. The NACO image has been resampled by a factor four, resulting in the same pixel scale as the ZIMPOL image (3.315 mas pix−1). The position of A is marked with a black “+” symbol in the left images and the position of B is shown with a white circle.
Current usage metrics show cumulative count of Article Views (full-text article views including HTML views, PDF and ePub downloads, according to the available data) and Abstracts Views on Vision4Press platform.
Data correspond to usage on the plateform after 2015. The current usage metrics is available 48-96 hours after online publication and is updated daily on week days.
Initial download of the metrics may take a while.