Fig. 2
Download original image
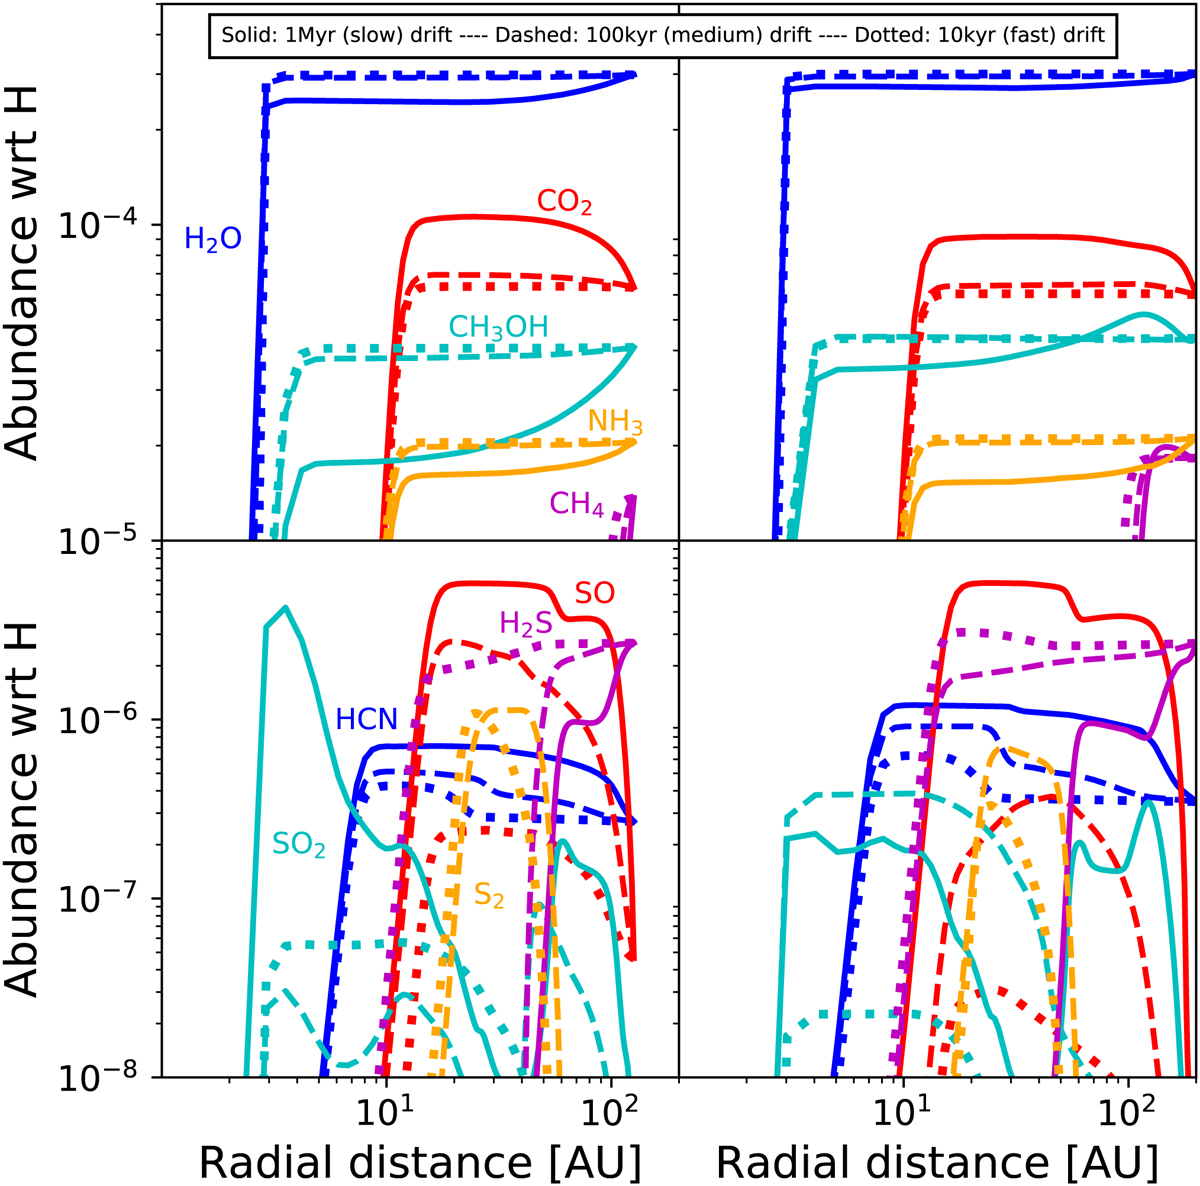
Abundances of volatile ices on a drifting pebble as a function of radius (time), where the pebbles moves inwards with time. Left is drift from 128 AU, right is drift from 200 AU. Top panels are for species with abundances larger than 10−5 wrt H (H2O, CO2 CH3OH, NH3 and CH4). Bottom panels are for species with abundances ranging from 10−8–10−5 (HCN, SO, SO2, H2S and S2). Solid profiles are for slow drift (1 Myr), dashed profiles are for medium drift (100 kyr) and dotted profiles are for fast drift (10 kyr). Colours correspond to the same species in both panels. We note that the top and bottom panels have different dynamical y-axis ranges.
Current usage metrics show cumulative count of Article Views (full-text article views including HTML views, PDF and ePub downloads, according to the available data) and Abstracts Views on Vision4Press platform.
Data correspond to usage on the plateform after 2015. The current usage metrics is available 48-96 hours after online publication and is updated daily on week days.
Initial download of the metrics may take a while.