Fig. 2
Download original image
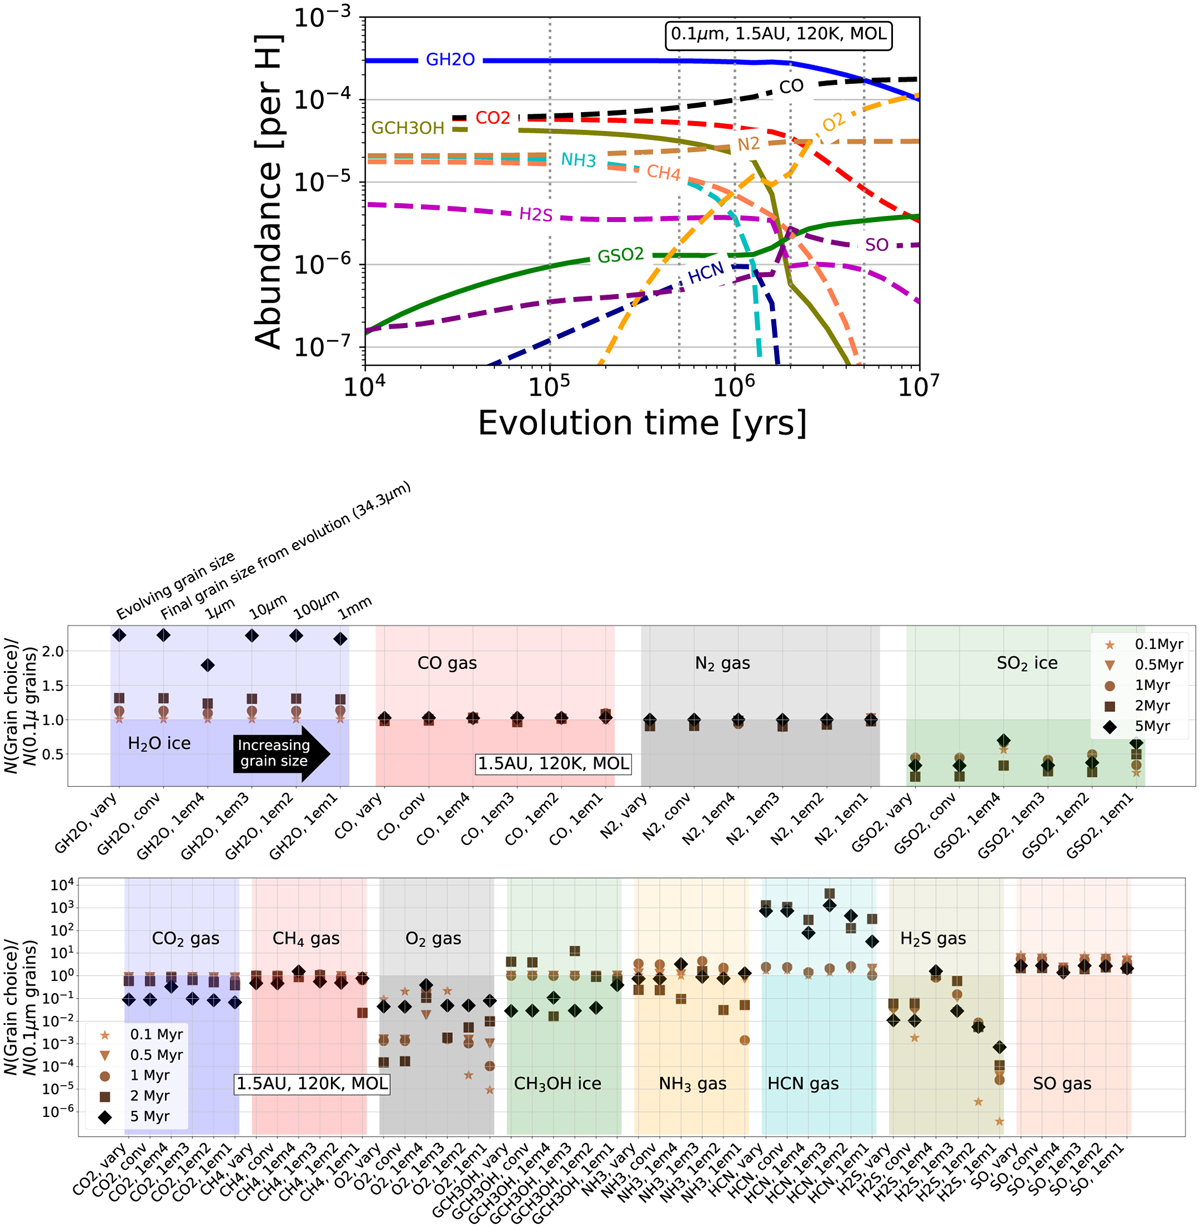
Evolution of chemical abundances, for various choices of grain size. Top panel: evolution of chemical abundances at 1.5 AU starting with molecular (MOL) abundances for a constant grain size of Rgrain = 0.1 μm. Solid profiles show ices (species names starting with G). Dashed profiles show gases. Middle and bottom panels: time- and grain-choice-dependent abundances relative to abundances assuming Rgrain = 0.1 μm. The y-axes are linear for the middle panels and logarithmic for the bottom panels. The vertical dotted lines in the top panel indicate evolution times (0.1, 0.5, 1, 2, and 5 Myr) associated with the markers in the middle and bottom panels. The blue shaded area for H2O ice in the middle panel has additional annotation for guidance: the first vertical category assumes an evolving grain size that grows with time (as annotated above the plot). The second category assumes the final (constant) grain size from the grain growth models, which here, at 1.5 AU, is 34.3 μm (see Table 1). The following four categories represent log-spaced grain size increases (as also indicated with the black arrow, indicating increasing grain sizes extending from categories three through six). This sequence of x-axis categories is identical in all middle and bottom panels in Figs. 2–9.
Current usage metrics show cumulative count of Article Views (full-text article views including HTML views, PDF and ePub downloads, according to the available data) and Abstracts Views on Vision4Press platform.
Data correspond to usage on the plateform after 2015. The current usage metrics is available 48-96 hours after online publication and is updated daily on week days.
Initial download of the metrics may take a while.