Fig. A.1
Download original image
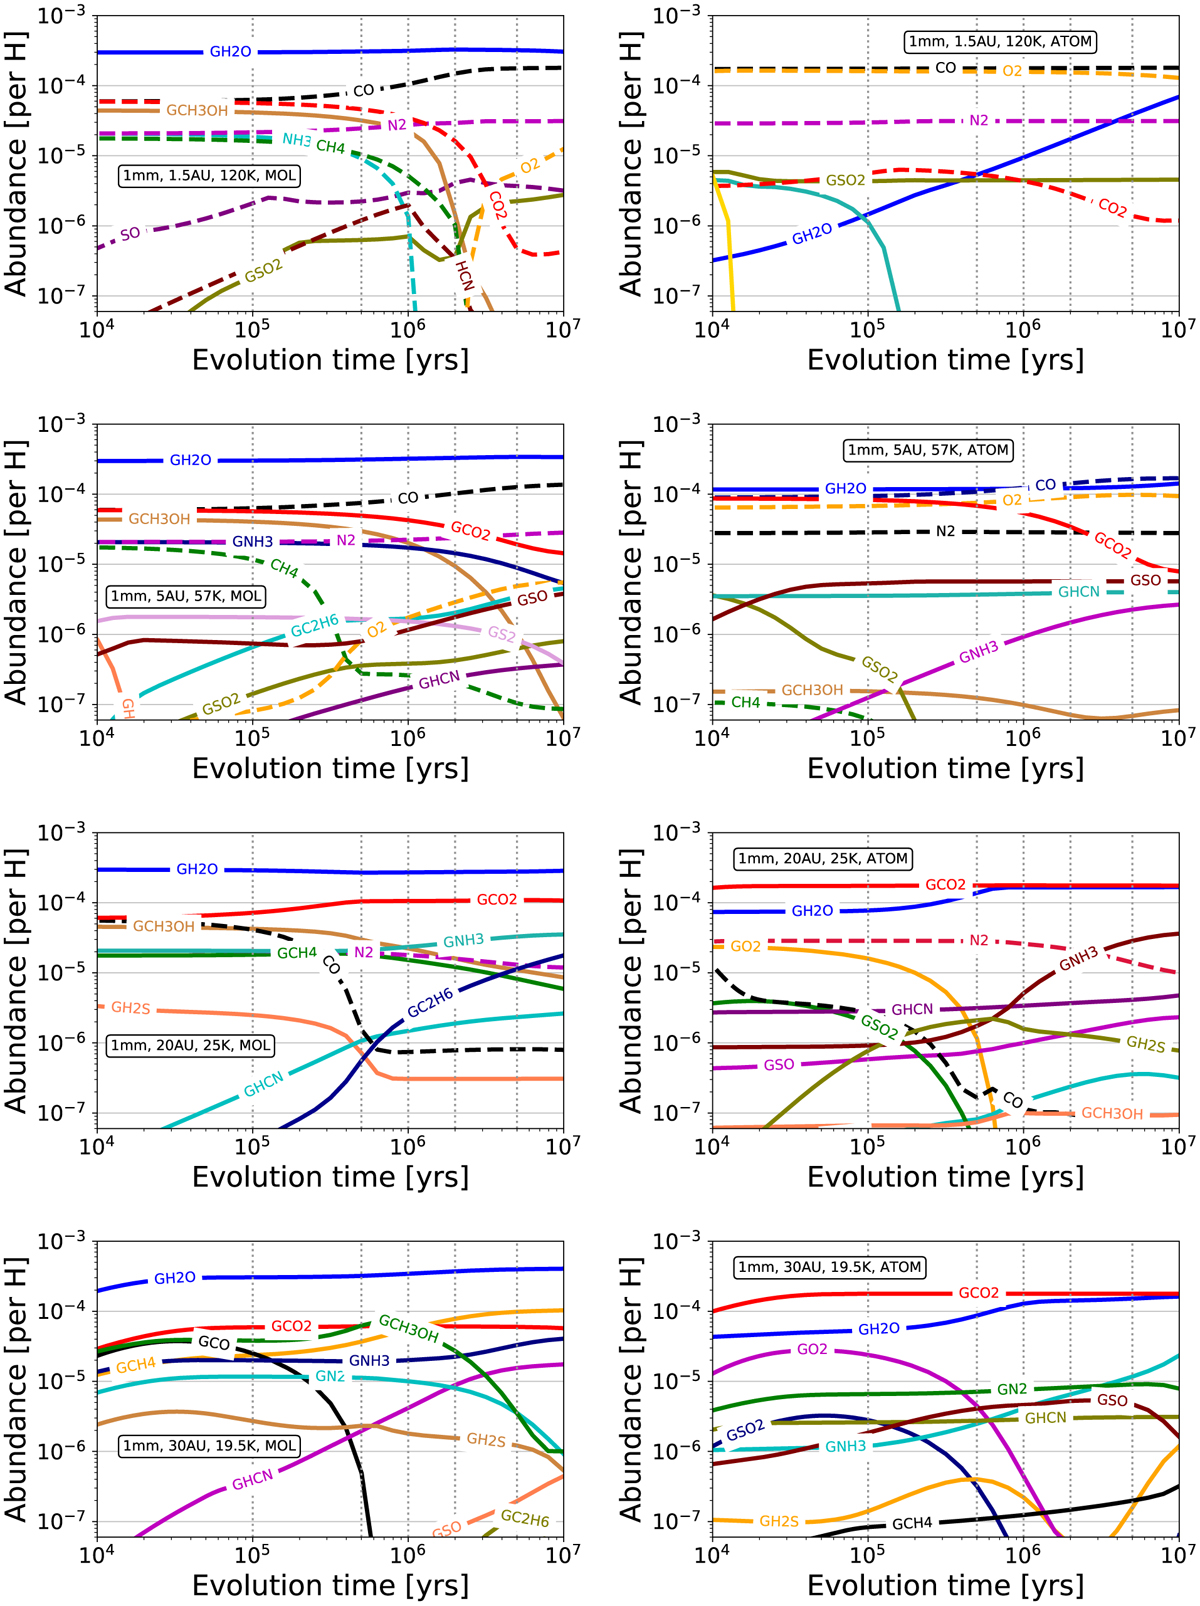
Evolution of chemical abundances at all radii (top to bottom: 1.5, 5, 20, and 30 AU) for a constant grain size of Rgrain = 1mm. Solid profiles show ices (species names starting with G). Dashed profiles show gases. Left panels: Chemical models initiated with all elemental C, O, N, and S in molecules (MOL in inset). Right panels: Chemical models initiated with all elemental C, O, N, and S as atoms (ATOM in inset). Vertical dotted lines indicate the evolution times used for the analysis: 0.1Myr, 0.5Myr, 1Myr, 2Myr, and 5Myr.
Current usage metrics show cumulative count of Article Views (full-text article views including HTML views, PDF and ePub downloads, according to the available data) and Abstracts Views on Vision4Press platform.
Data correspond to usage on the plateform after 2015. The current usage metrics is available 48-96 hours after online publication and is updated daily on week days.
Initial download of the metrics may take a while.