Open Access
Fig. 3.
Download original image
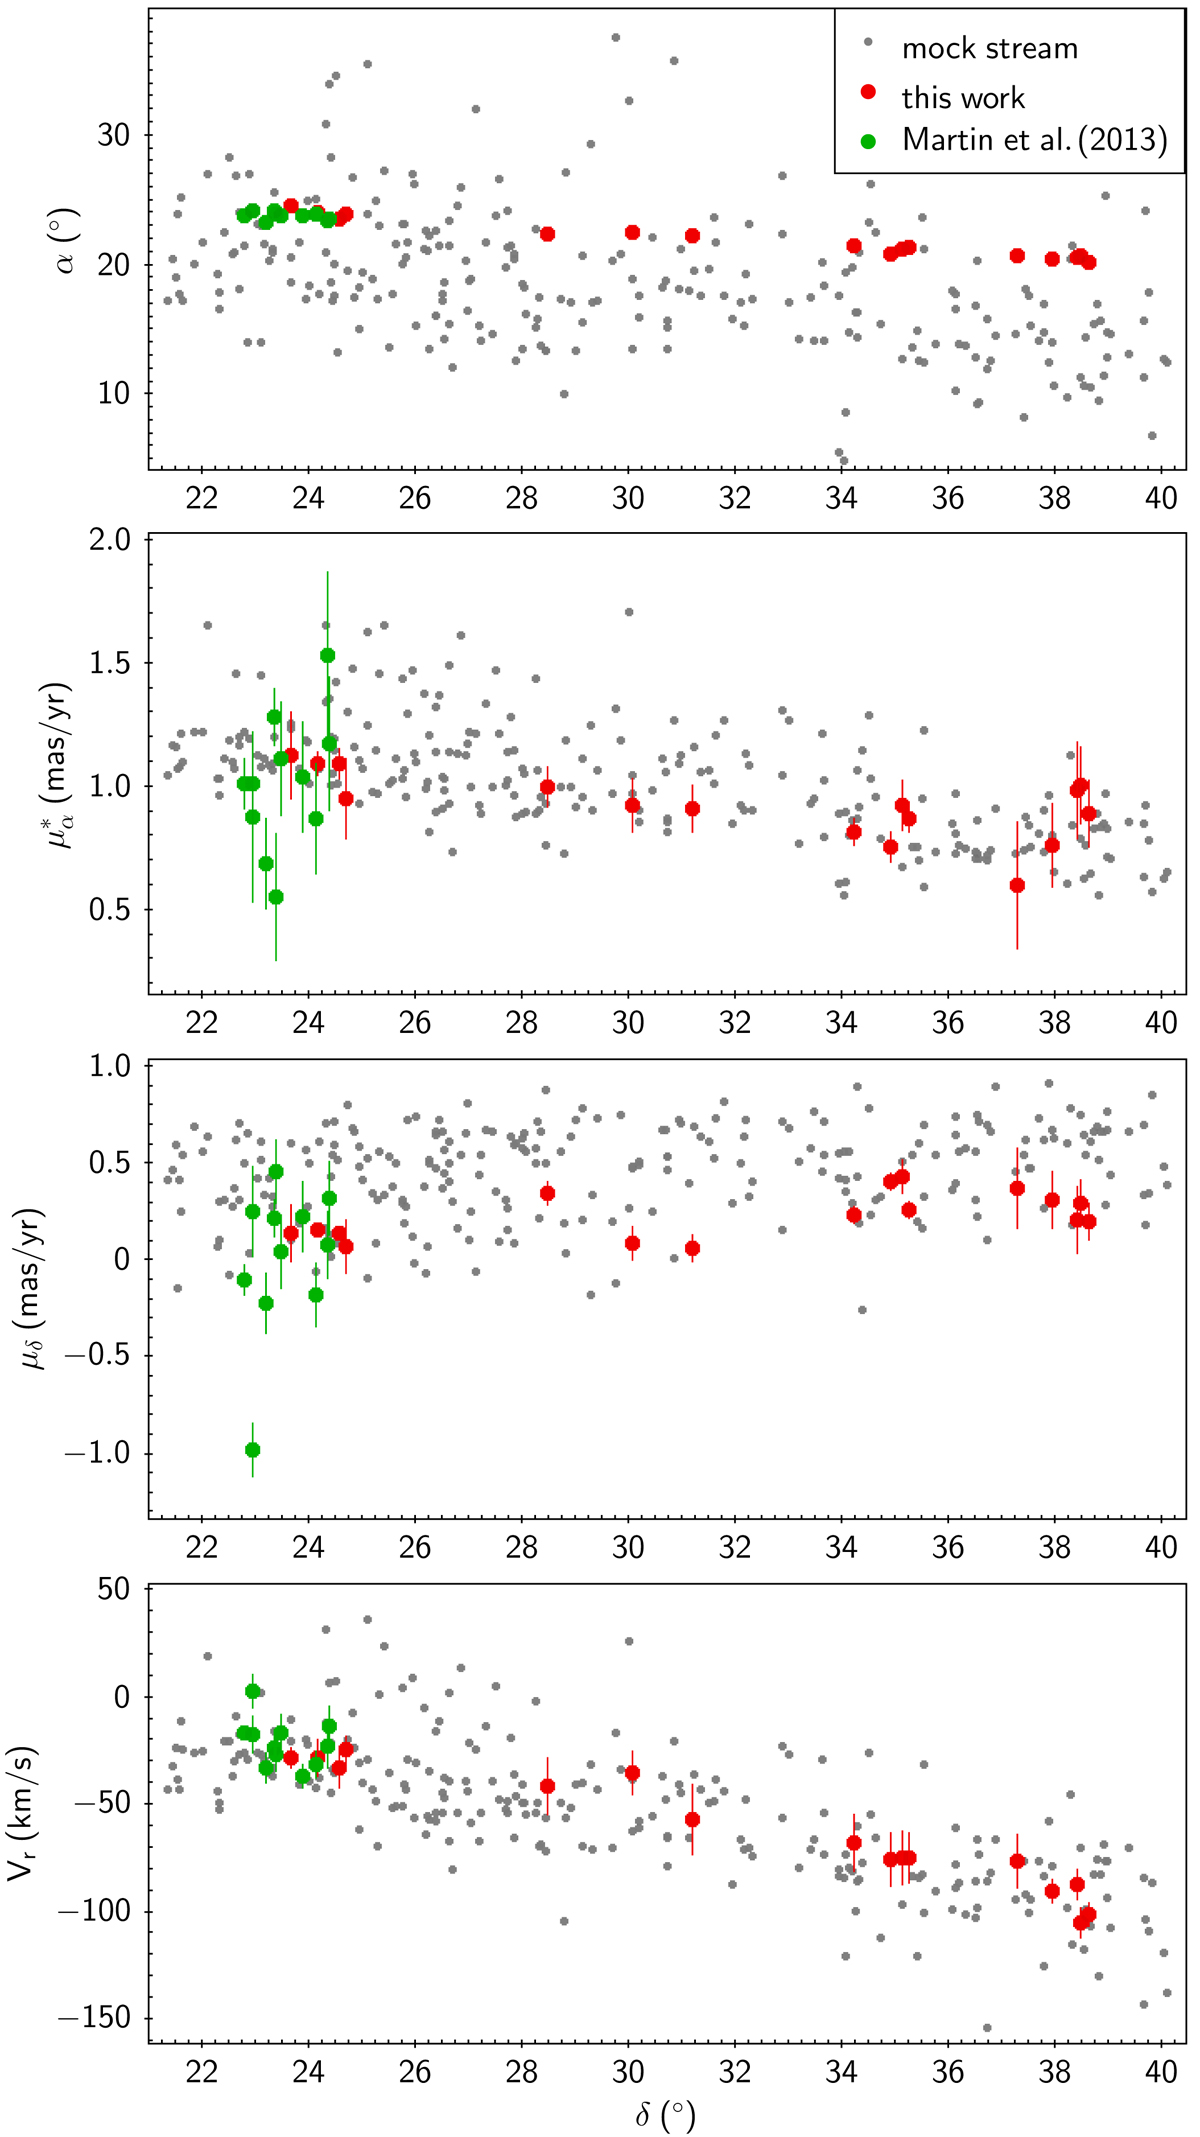
Right ascension α, PMs ![]() and μδ, and radial velocity Vr as a function of declination δ are presented from top to bottom. The gray dots represent the stream particles within the same sky area as Triangulum. The green and red points represent the stream member stars.
and μδ, and radial velocity Vr as a function of declination δ are presented from top to bottom. The gray dots represent the stream particles within the same sky area as Triangulum. The green and red points represent the stream member stars.
Current usage metrics show cumulative count of Article Views (full-text article views including HTML views, PDF and ePub downloads, according to the available data) and Abstracts Views on Vision4Press platform.
Data correspond to usage on the plateform after 2015. The current usage metrics is available 48-96 hours after online publication and is updated daily on week days.
Initial download of the metrics may take a while.