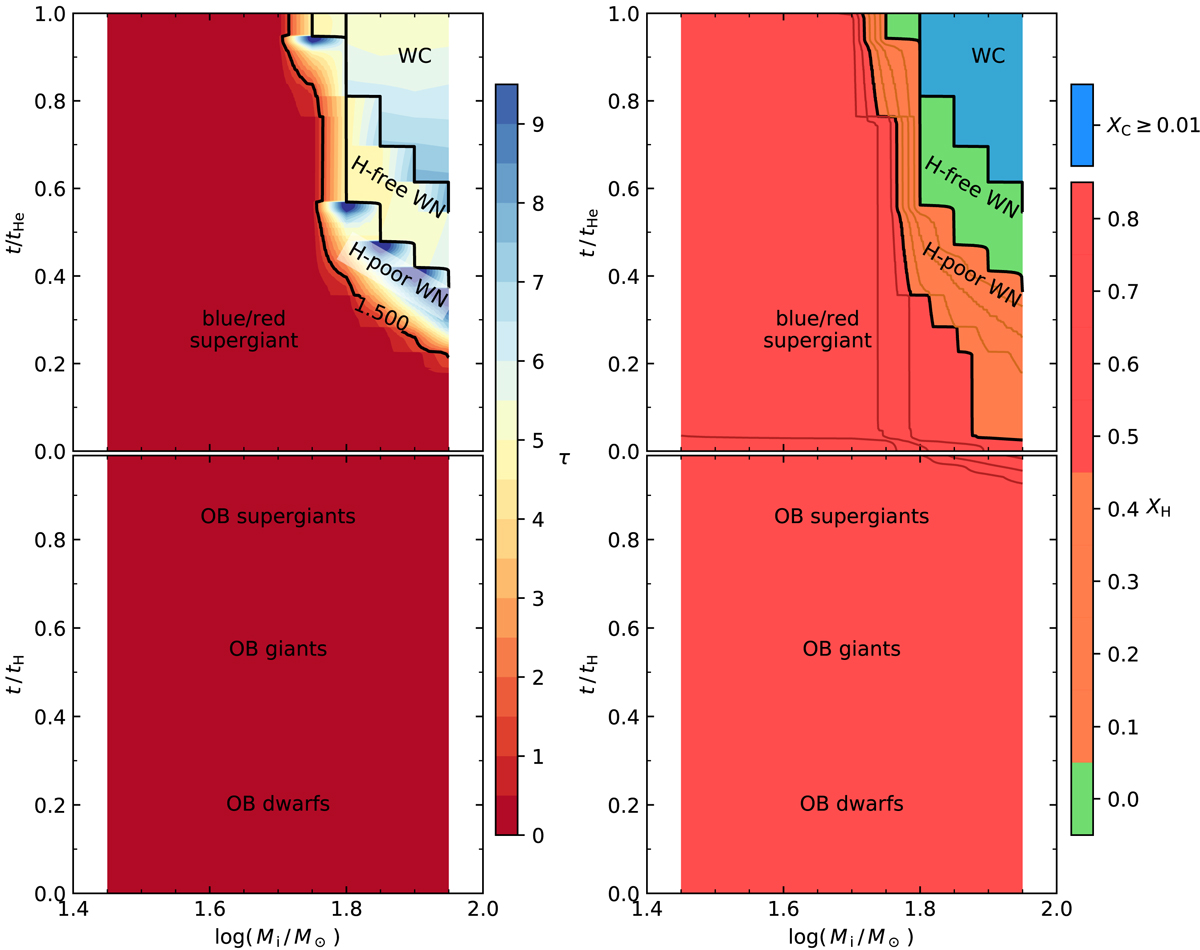
Fig. A.1.

Download original image
Optical depth (left, color-coded) and surface hydrogen abundance (right) of our single star models as function of initial mass and normalized time, during their main-sequence (lower) and core helium burning (upper) evolution. The transition line from an optically thin to an optically thick wind is marked by a solid black line labeled with “1.500”. The unlabeled solid black lines divide the different considered WR phases as labeled in each region. In the right plot, threshold values of the surface hydrogen abundances in steps of ΔXH = 0.1 are indicated by thin solid lines, which have dark red color for the range XH = 0.8 − 0.5 and brown color for XH = 0.4 − 0.1. The borderlines of XH = 0.4 and XH = 0.0 are marked by solid black lines, as well as the borderline beyond which stellar models have a surface carbon mass fraction in excess of XC = 0.01, which is our threshold for defining WC stars.
Current usage metrics show cumulative count of Article Views (full-text article views including HTML views, PDF and ePub downloads, according to the available data) and Abstracts Views on Vision4Press platform.
Data correspond to usage on the plateform after 2015. The current usage metrics is available 48-96 hours after online publication and is updated daily on week days.
Initial download of the metrics may take a while.


