Open Access
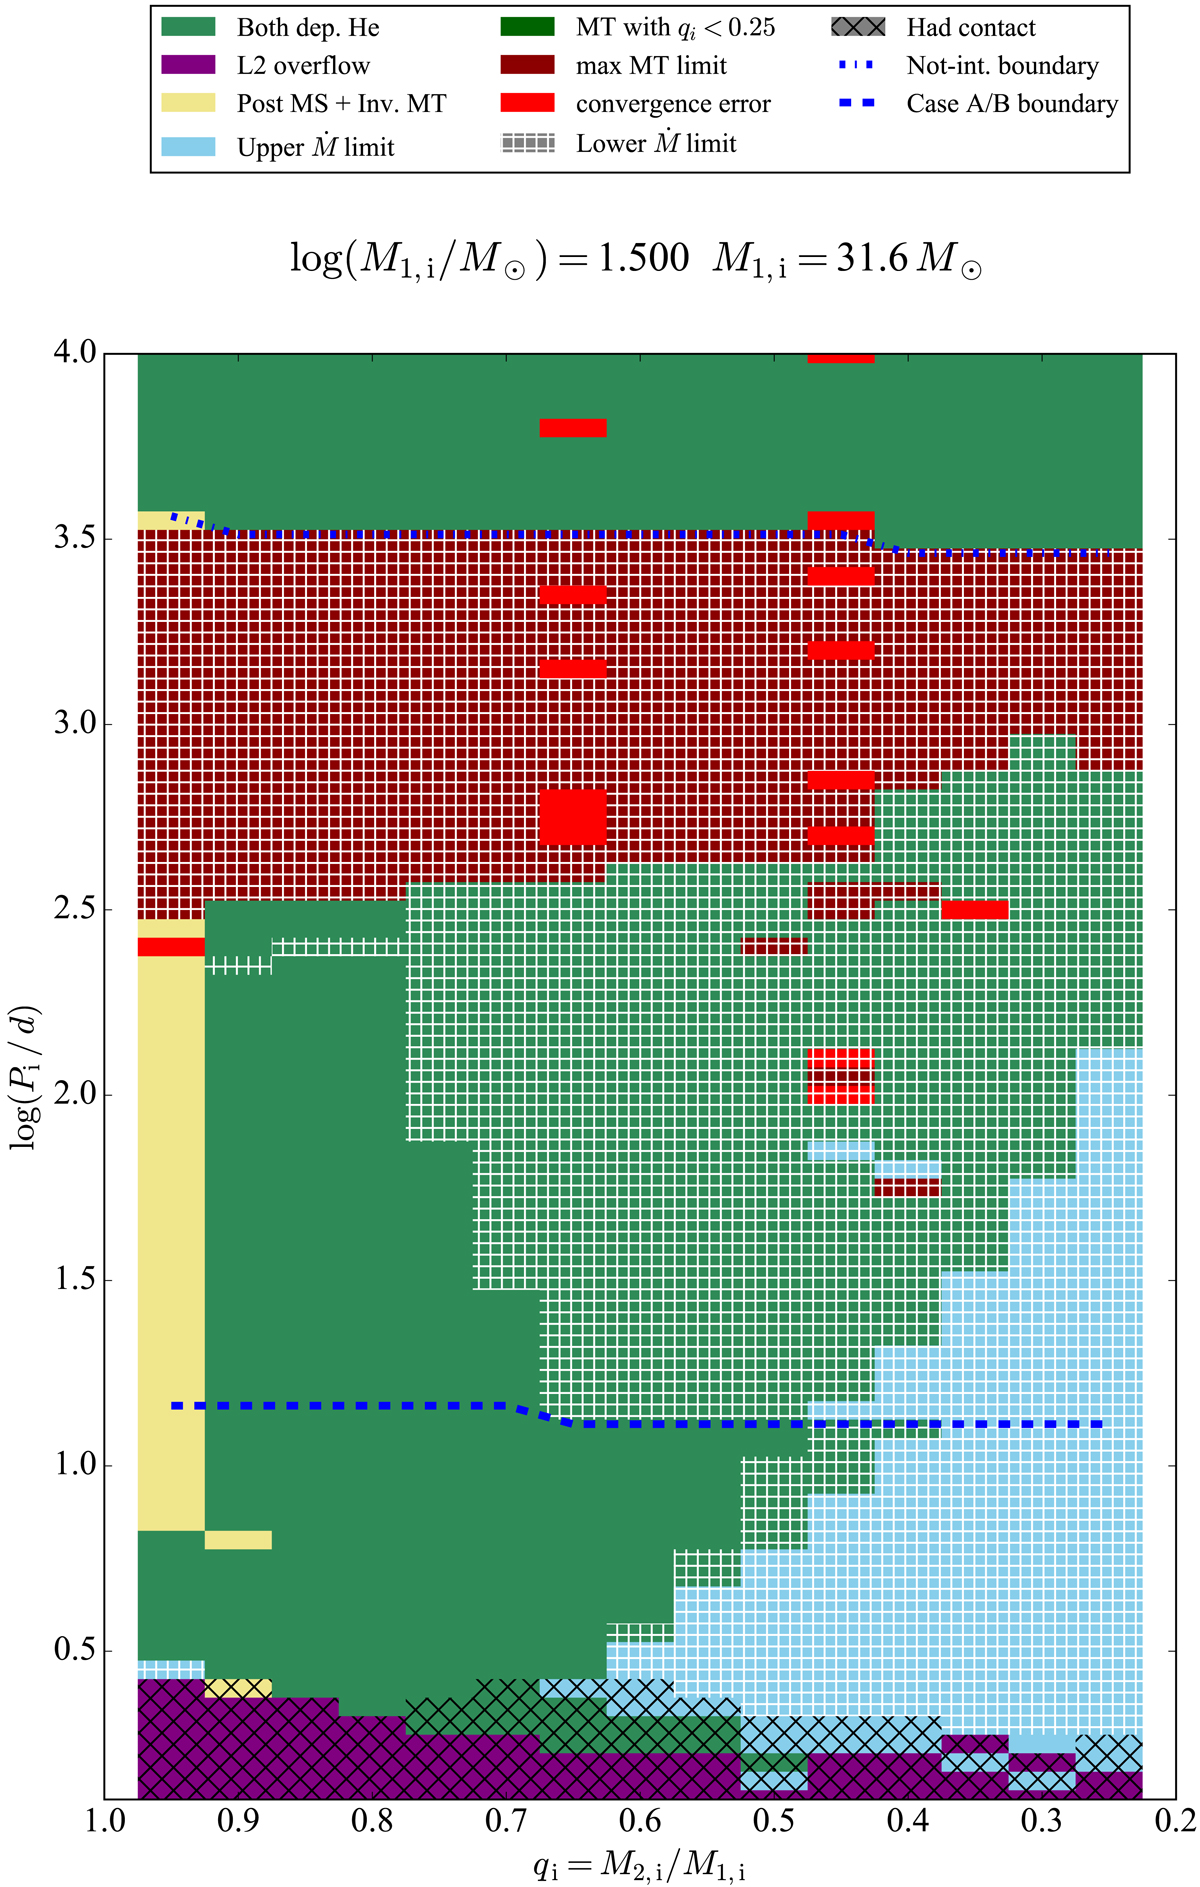
Fig. C.1.
Download original image
Phase diagram of binary models with a fixed initial donor mass of M1, i = 31.6 M⊙. The initial mass ratio q i is plotted versus the initial orbital period P i. The different phases are indicated in the legend and a more detailed description can be found in the text.
Current usage metrics show cumulative count of Article Views (full-text article views including HTML views, PDF and ePub downloads, according to the available data) and Abstracts Views on Vision4Press platform.
Data correspond to usage on the plateform after 2015. The current usage metrics is available 48-96 hours after online publication and is updated daily on week days.
Initial download of the metrics may take a while.