Fig. 9
Download original image
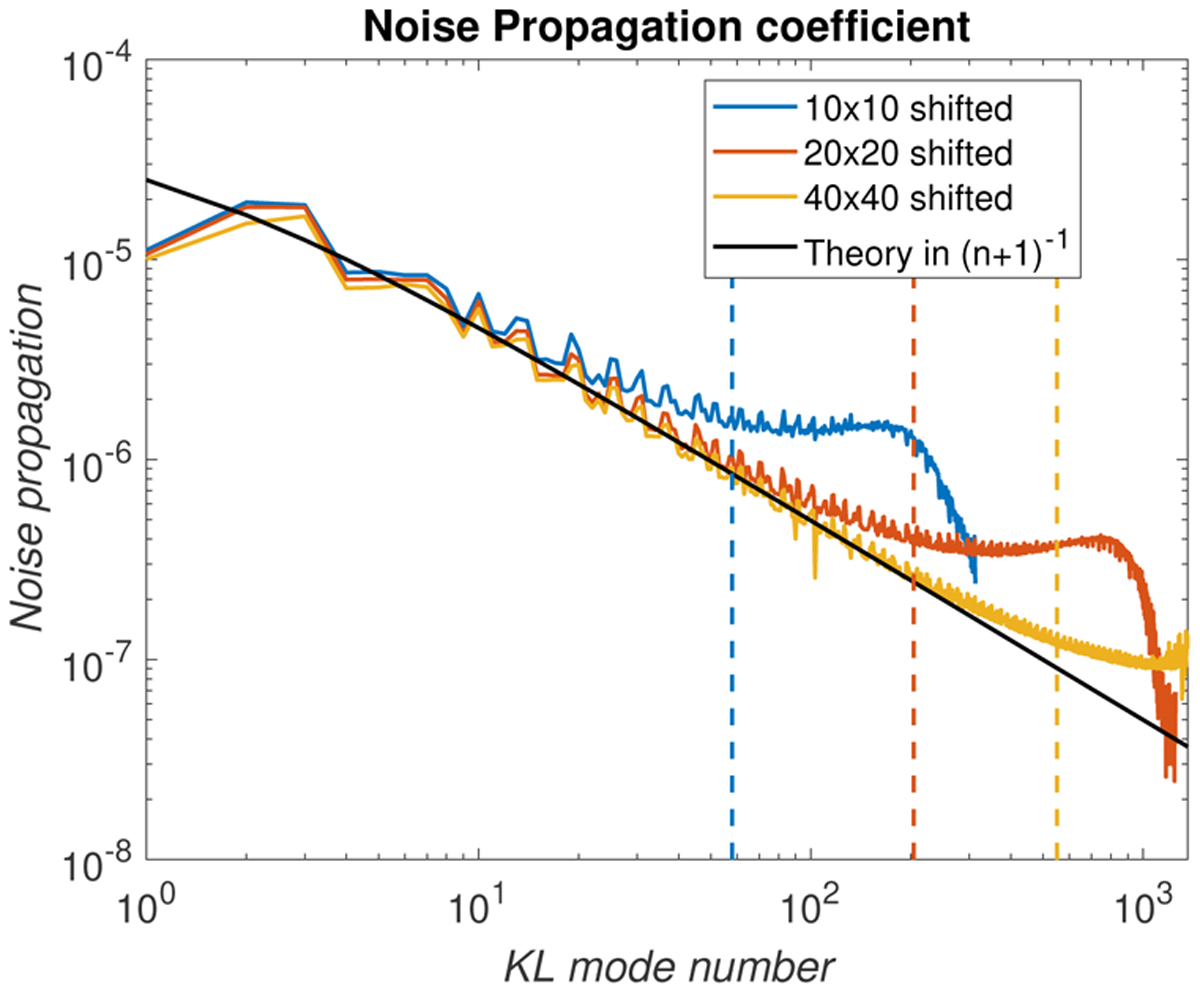
Noise propagation coefficients, computed as diag{RRT}, shown in logarithmic scale and scaled by the flux collecting surface of the sub-aperture. The shifted cases are plotted with solid lines. For the sake of visibility, dashed lines are overlayed at the level of the spatial frequencies where the aliasing starts being prominent for the co-aligned cases. Along the low order modes, the noise propagation is quasi identical for all cases and fit the expected law in (n + 1)−1. Then, when exceeding the original Nyquist–Shannon cut-off frequency, the noise propagation coefficient converges towards a constant asymptotic limit.
Current usage metrics show cumulative count of Article Views (full-text article views including HTML views, PDF and ePub downloads, according to the available data) and Abstracts Views on Vision4Press platform.
Data correspond to usage on the plateform after 2015. The current usage metrics is available 48-96 hours after online publication and is updated daily on week days.
Initial download of the metrics may take a while.