Fig. 2
Download original image
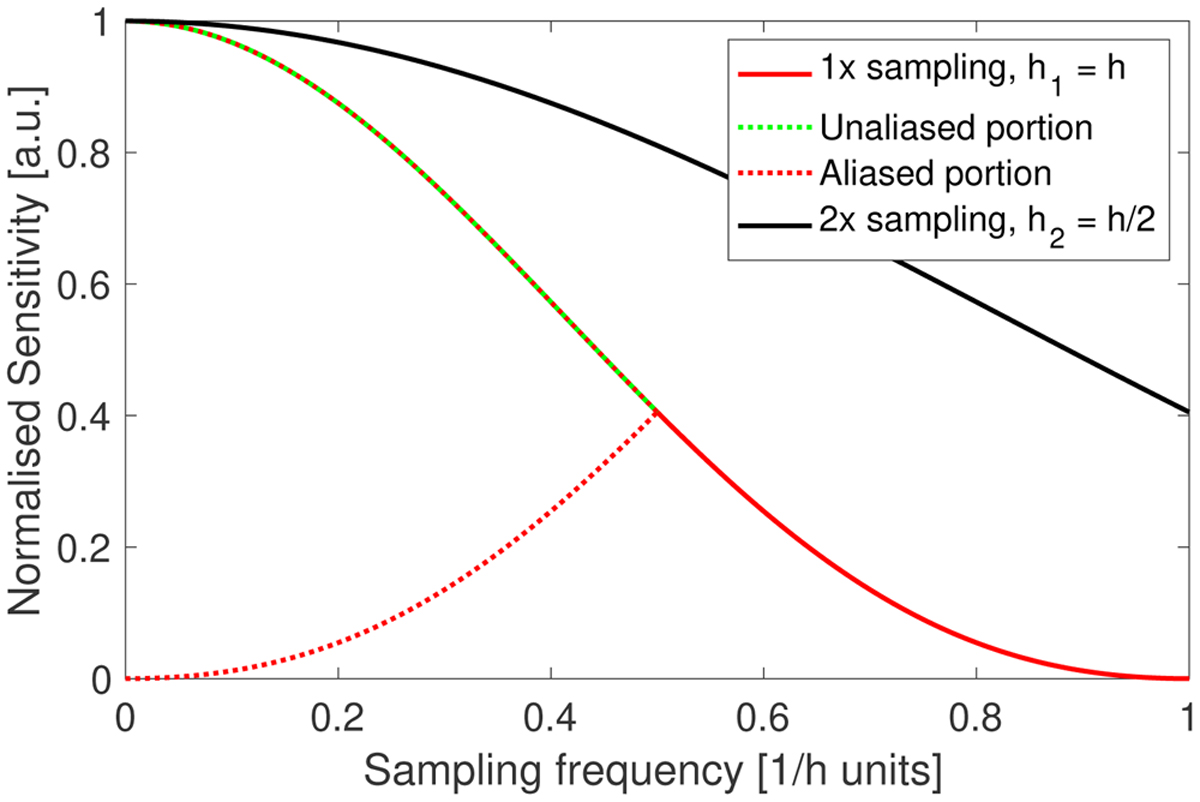
Normalised sensitivity of a virtual averaging-and-sampler sensor used for illustration purposes only. The black curve corresponds to the sensitivity function of a sampling grid of step h/2. The dotted curve represents the sensitivity of a sampling grid of step h. The red curve is obtained by dealiasing the spectral sensitivity up to 1/h, that is, the first null of the sinc function with a super-resolution factor of 2; by combining two sampling grids of step h relatively shifted by h/2 with respect to each other.
Current usage metrics show cumulative count of Article Views (full-text article views including HTML views, PDF and ePub downloads, according to the available data) and Abstracts Views on Vision4Press platform.
Data correspond to usage on the plateform after 2015. The current usage metrics is available 48-96 hours after online publication and is updated daily on week days.
Initial download of the metrics may take a while.