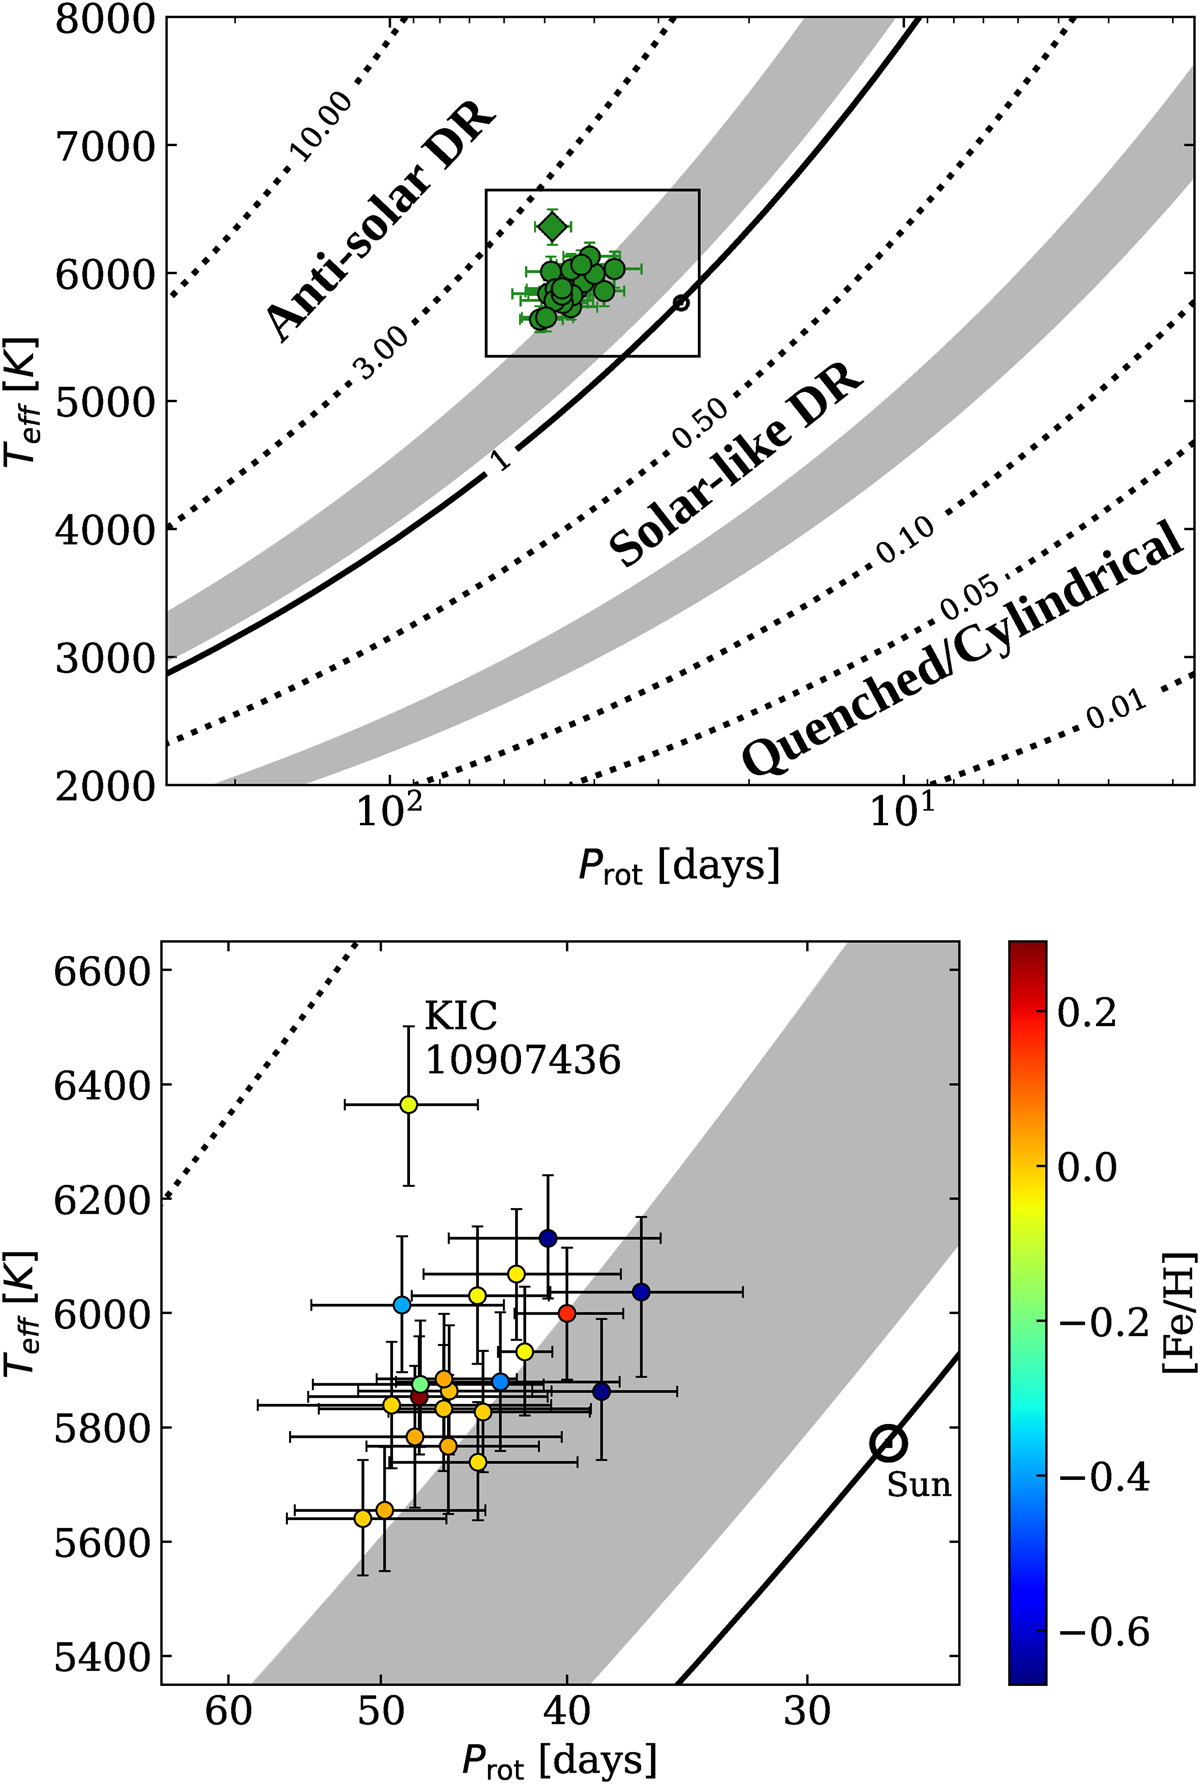
Fig. 4.
Download original image
DR diagram in which different DR regimes are expected: anti-solar, solar-type, and quenched or cylindrical (see Fig. 1). Gray regions represent transition regions between DR regimes. Top: dotted lines represent constant Rof/Rof, ⊙ as a function of Teff and Prot as deduced from Eq. (18). The solid black line represents the value Rof/Rof, ⊙ = 1. Bottom: zoom into the top panel around the anti-solar DR candidates, color-coded by metallicity.
Current usage metrics show cumulative count of Article Views (full-text article views including HTML views, PDF and ePub downloads, according to the available data) and Abstracts Views on Vision4Press platform.
Data correspond to usage on the plateform after 2015. The current usage metrics is available 48-96 hours after online publication and is updated daily on week days.
Initial download of the metrics may take a while.