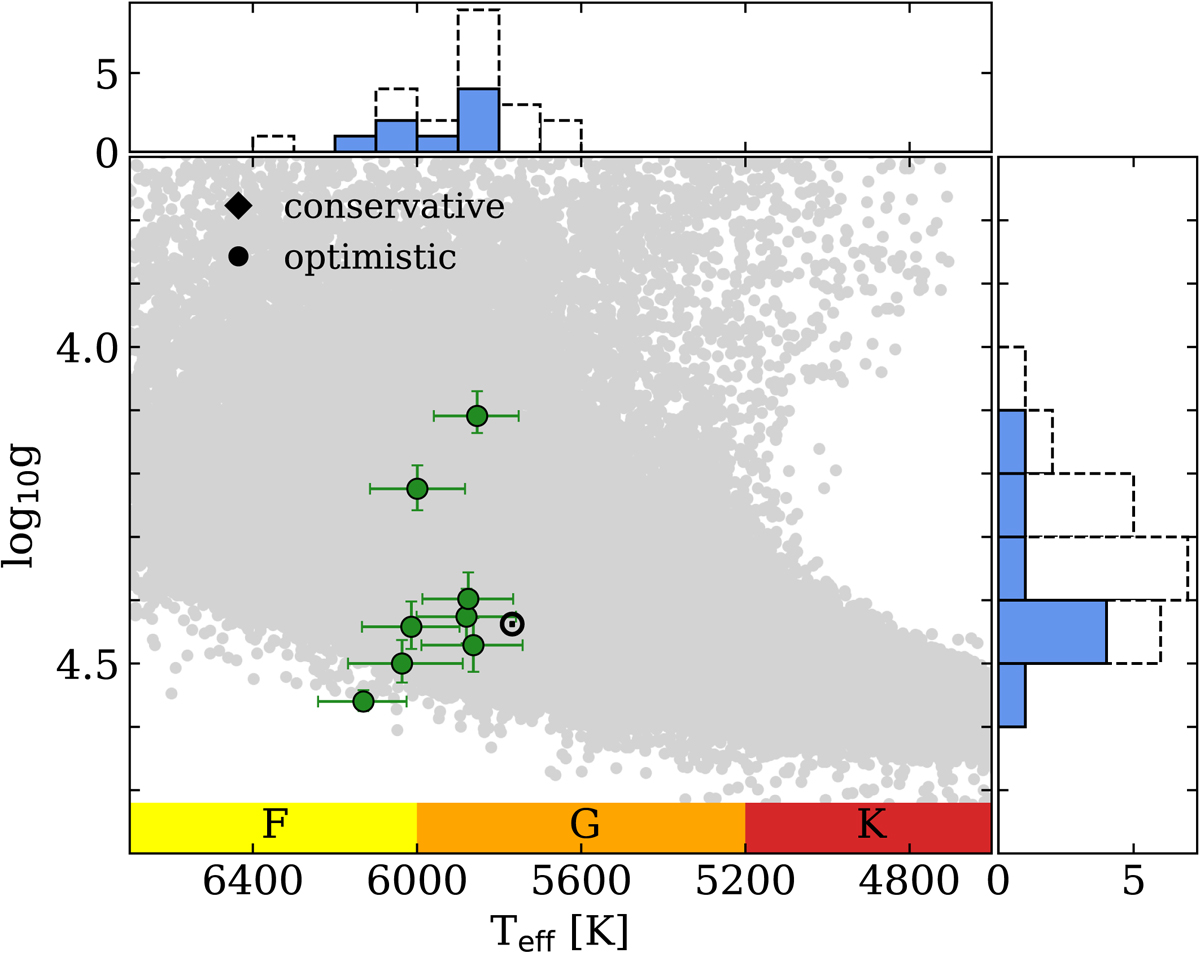
Fig. 3.
Download original image
Similar to Fig. 2 for anti-solar DR candidates beyond the solar metallicity range, summarized in Table 2. All of them are part of the optimistic sample. They are illustrated with green circles. Blue histograms on the x- and y-axes are proposed for the green dot sample. For comparison, we add dotted black histograms, which represent the whole set of candidates for all metallicities (i.e., the targets in Tables 1 and 2 ).
Current usage metrics show cumulative count of Article Views (full-text article views including HTML views, PDF and ePub downloads, according to the available data) and Abstracts Views on Vision4Press platform.
Data correspond to usage on the plateform after 2015. The current usage metrics is available 48-96 hours after online publication and is updated daily on week days.
Initial download of the metrics may take a while.