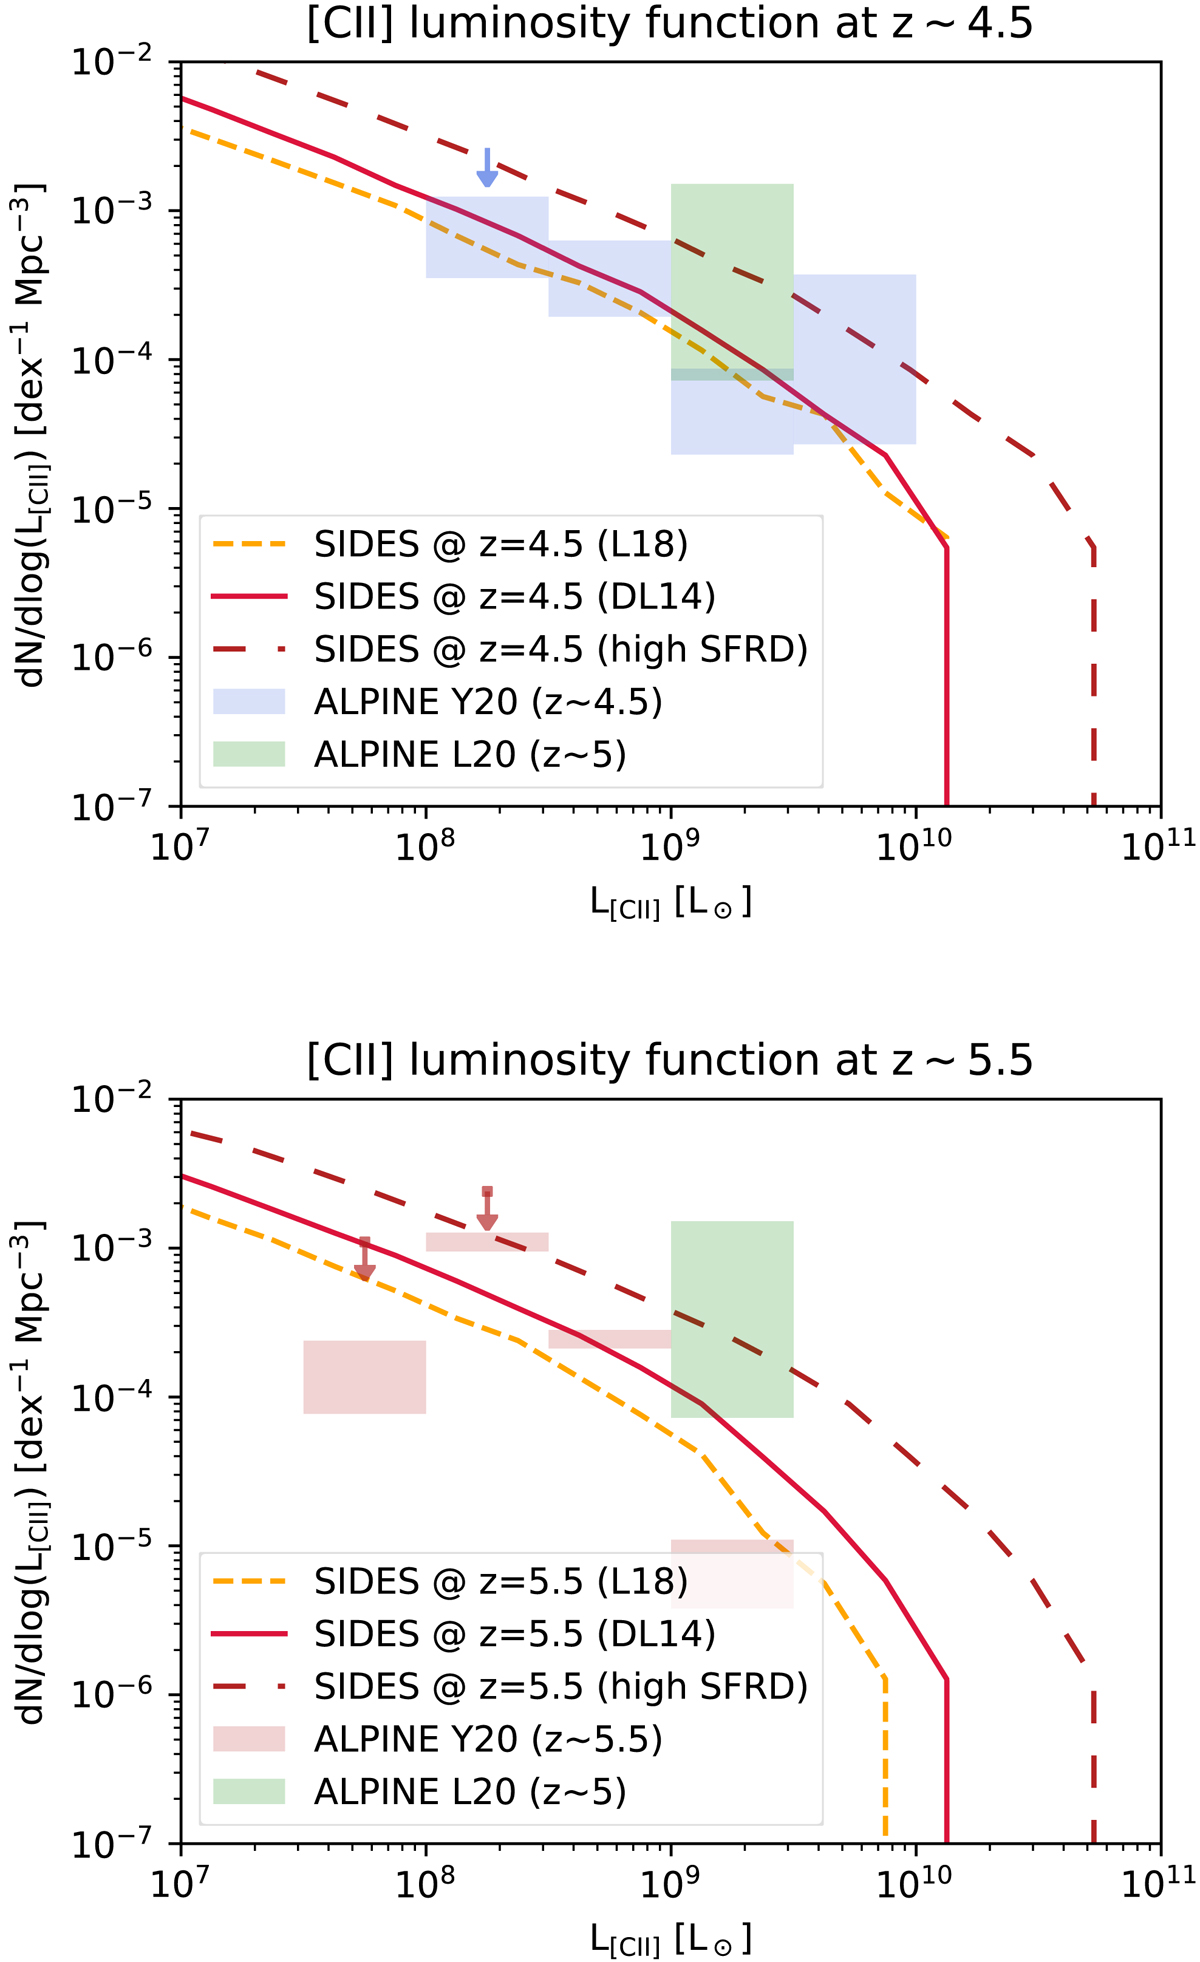
Fig. 9.
Download original image
Current constraints on the [CII] luminosity function at z ∼ 4.5 (upper panel) and z ∼ 5.5 (lower panel), and comparison with our SIDES simulation. The filled blue (z ∼ 4.5) and red (z ∼ 5.5) rectangles show the reconstruction of the luminosity function from the ALPINE sample (Yan et al. 2020). The two data points at the lowest luminosities could be impacted by non-detections and the upper limits estimated by Yan et al. (2020) are shown as downward arrows. The constraint at z ∼ 5 using the other sideband of ALPINE is shown with green rectangles (Loiacono et al. 2021). The solid red lines and the dashed orange lines are the SIDES results, assuming the DL14 or the L18 relation, respectively. The long-dashed brown line is the flat high-z SFRD version of SIDES.
Current usage metrics show cumulative count of Article Views (full-text article views including HTML views, PDF and ePub downloads, according to the available data) and Abstracts Views on Vision4Press platform.
Data correspond to usage on the plateform after 2015. The current usage metrics is available 48-96 hours after online publication and is updated daily on week days.
Initial download of the metrics may take a while.