Fig. 7.
Download original image
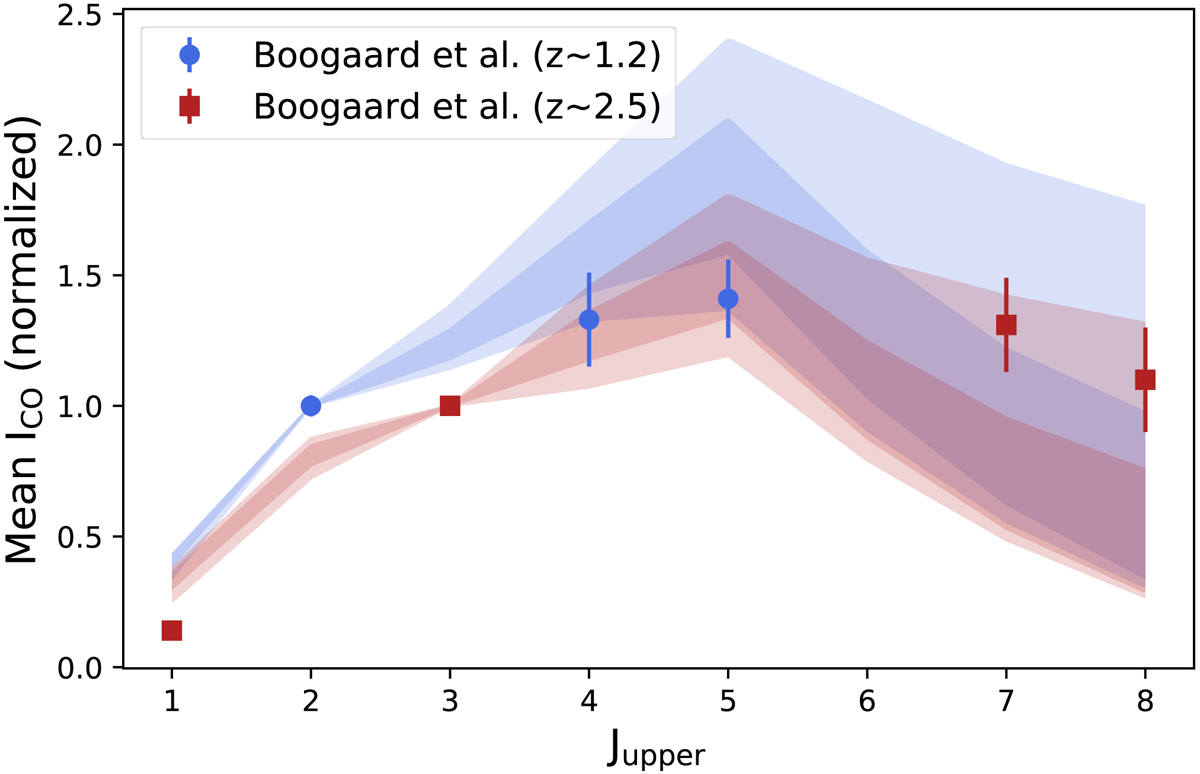
Comparison between the stacked SLEDs of Boogaard et al. (2020) and the results from SIDES. The filled blue and red circles represent the SLED of z ∼ 1.2 objects detected in CO(2–1). The red filled squares correspond to the z ∼ 2.5 objects detected in CO(3–2). The SLED is normalized to unity for the transition used to select the sample to stack. The light and dark shaded areas show, respectively, the 1 and 2σ confidence region of the mean SLED in our simulation, taking into account the sample variance (see Sect. 3.3).
Current usage metrics show cumulative count of Article Views (full-text article views including HTML views, PDF and ePub downloads, according to the available data) and Abstracts Views on Vision4Press platform.
Data correspond to usage on the plateform after 2015. The current usage metrics is available 48-96 hours after online publication and is updated daily on week days.
Initial download of the metrics may take a while.