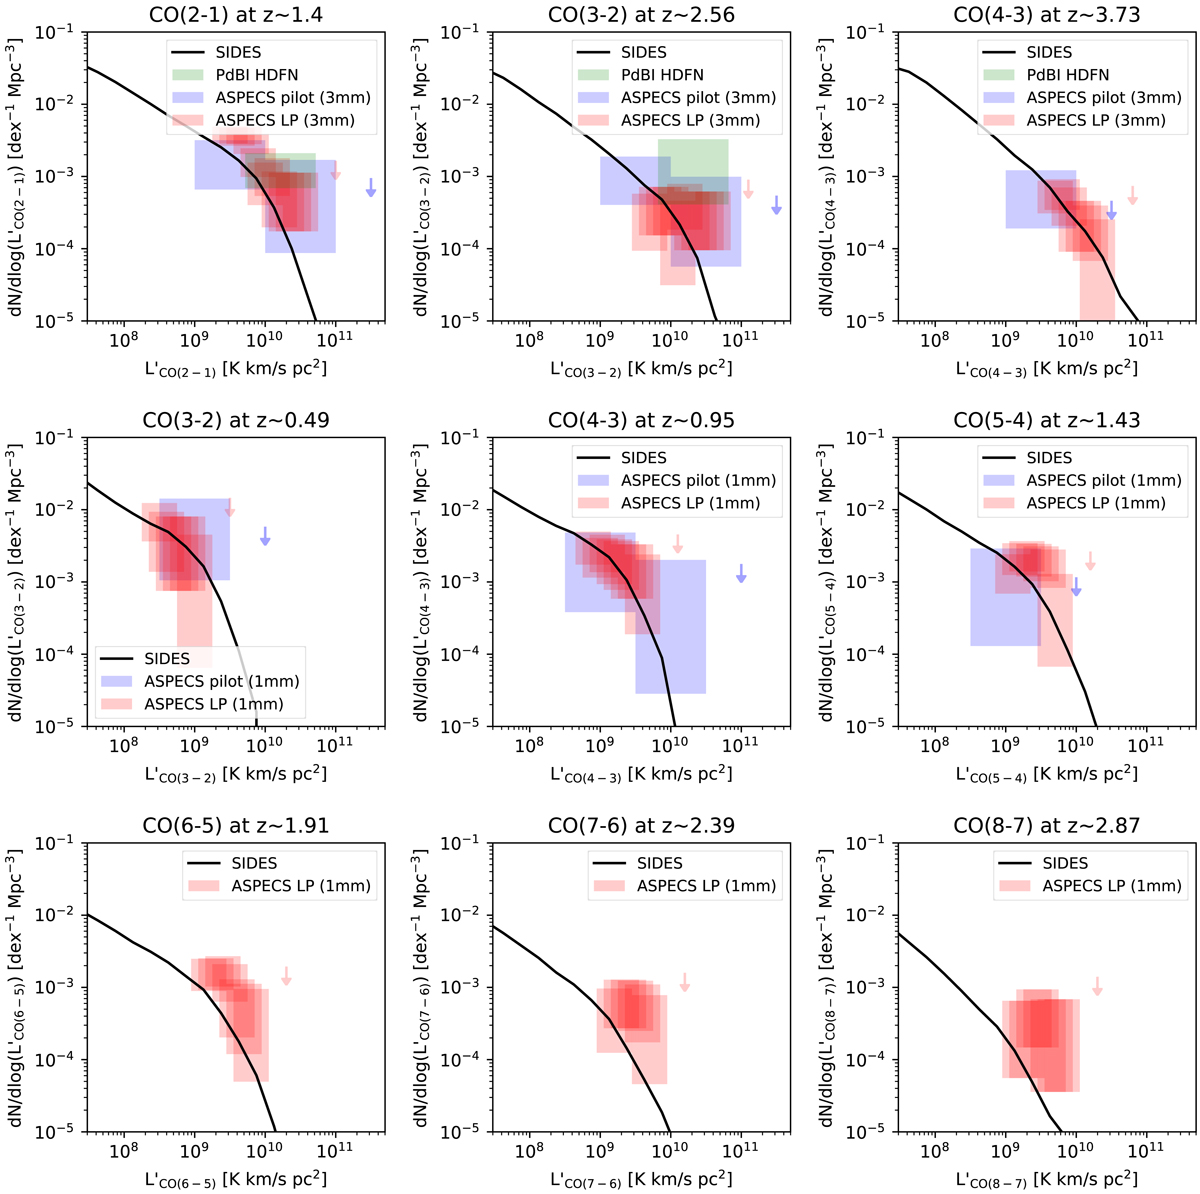
Fig. 6.
Download original image
Comparison between CO luminosity from the SIDES simulations (solid black lines) and the observations for various transitions and redshifts (see details above each panel). Observational data are represented by filled rectangles, whose width indicates the bin size and whose height shows the 1-σ confidence region. The PdBI HDFM program of Walter et al. (2016, 1 arcmin2) is in green. The ALMA/ASPECS pilot program is in blue (1 arcmin2 Decarli et al. 2016) and the large program is in red (4.6 arcmin2Decarli et al. 2019, 2020).
Current usage metrics show cumulative count of Article Views (full-text article views including HTML views, PDF and ePub downloads, according to the available data) and Abstracts Views on Vision4Press platform.
Data correspond to usage on the plateform after 2015. The current usage metrics is available 48-96 hours after online publication and is updated daily on week days.
Initial download of the metrics may take a while.