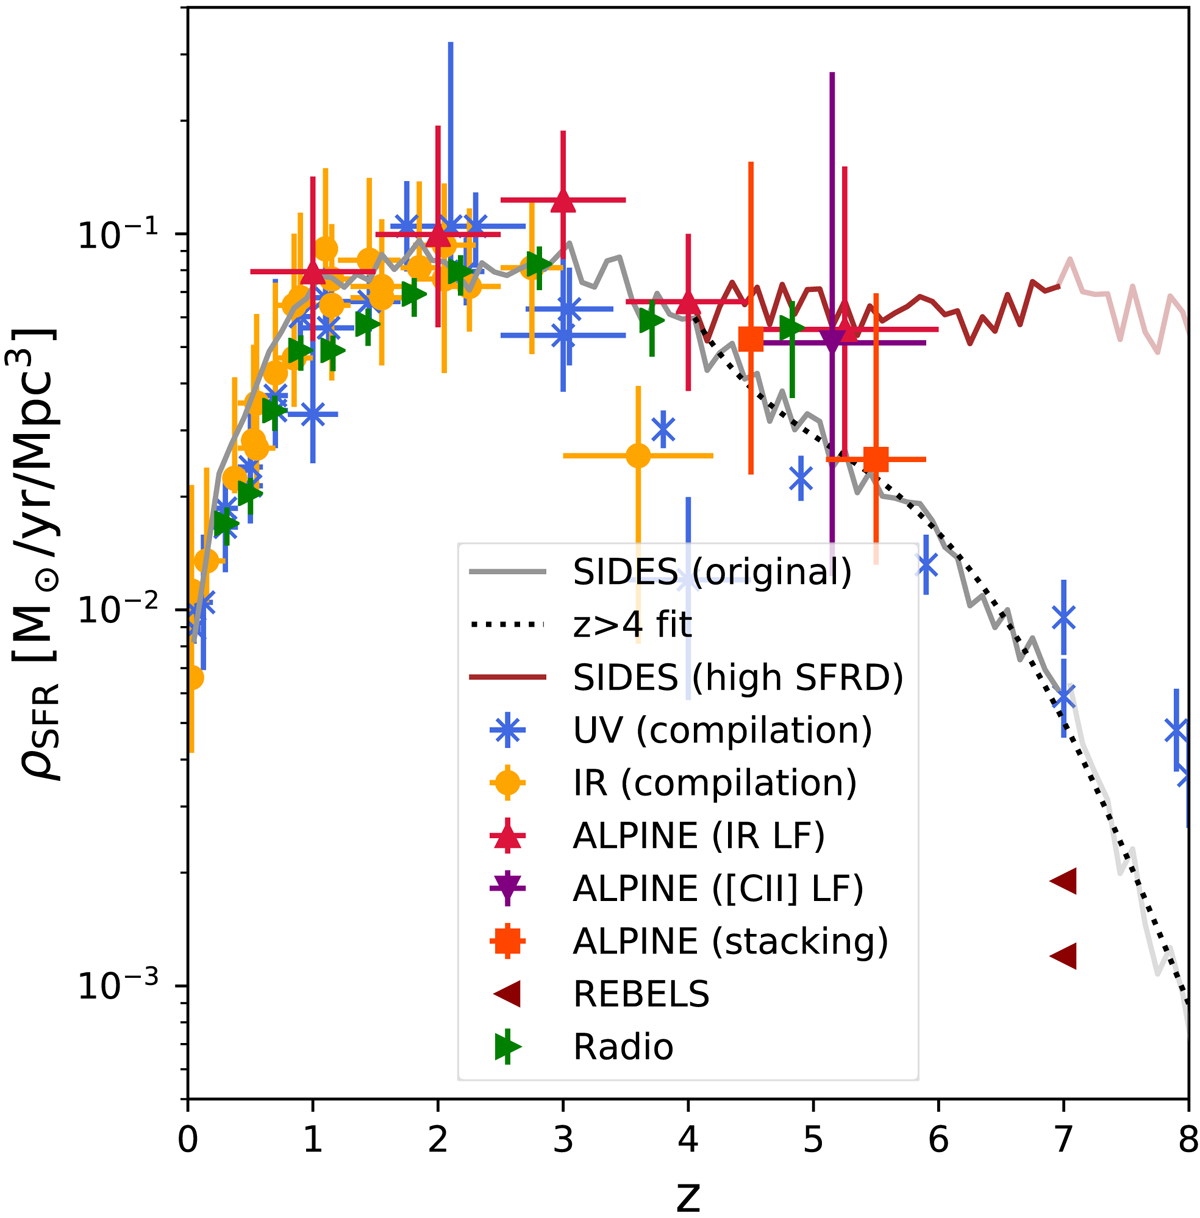
Fig. 3.
Download original image
Evolution of the star formation rate density. The solid gray line is derived from the SIDES simulation and the solid brown line is an alternative model at z > 4 for which we boosted the SFRs to obtain a flat SFRD at high-redshifts (“high SFRD” model, see Sect. 2.7). The SFR boosting factor to obtain a flat SFRD is computed from the fit of the z > 4 original model (dotted line). The compilations of UV-derived and infrared-derived measurements by Madau & Dickinson (2014) are represented by blue crosses and filled orange circles, respectively. We also show the measurement from the ALPINE survey based on the luminosity function of serendipitous continuum detections (Gruppioni et al. 2020, red upward-pointing triangles), the [CII] luminosity function of serendipitous detection (Loiacono et al. 2021, purple downward-pointing triangles), and an indirect method using the stacking of the target sample (Khusanova et al. 2021, dark orange squares). The dark red left-pointing triangles are the estimates of the obscured SFRD from REBELS by Fudamoto et al. (2021), using the continuum (low value) and the [CII] (high value). The constraints from the radio from Novak et al. (2017) are shown using green right-pointing triangles. As discussed in Sect. 4.4, the SFRD at z > 7 could be underestimated by our simulation because of its halo mass limit, and thus a paler color is used.
Current usage metrics show cumulative count of Article Views (full-text article views including HTML views, PDF and ePub downloads, according to the available data) and Abstracts Views on Vision4Press platform.
Data correspond to usage on the plateform after 2015. The current usage metrics is available 48-96 hours after online publication and is updated daily on week days.
Initial download of the metrics may take a while.