Fig. 18.
Download original image
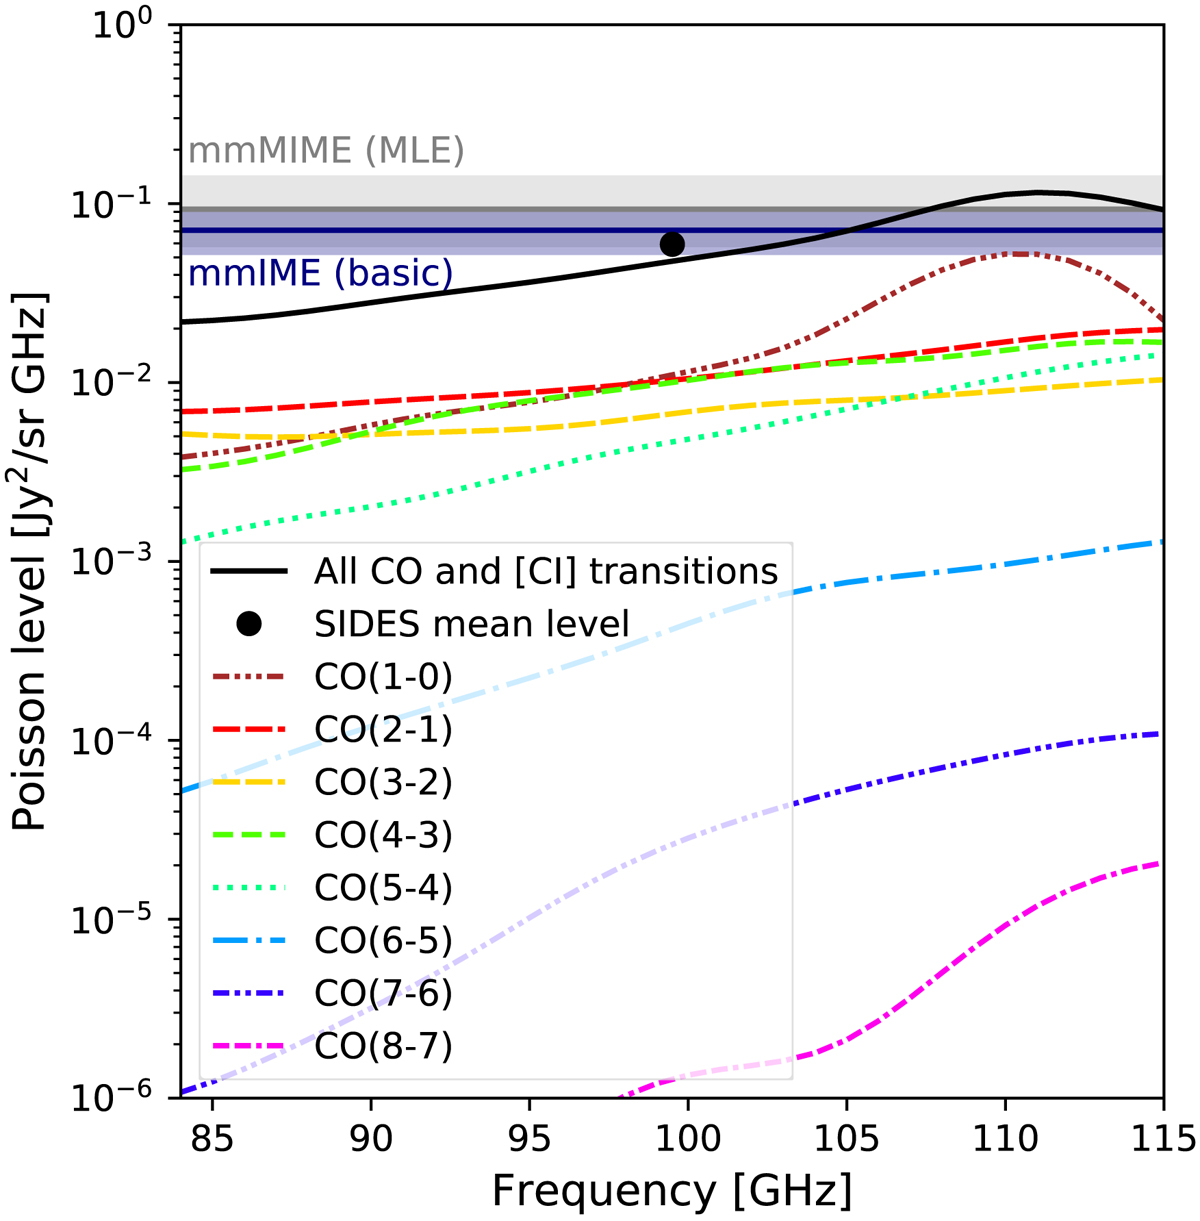
Shot-noise level predicted by SIDES as a function of frequency and a comparison with the mmIME measurements (Keating et al. 2020, total area of 20 arcmin2, horizontal dark gray line and associated 1σ area for the MLE method, dark blue line and area for the simpler instrumental noise correction). The frequency range shown in this figure corresponds to the mmIME used. The filled black circle is the average shot noise predicted by SIDES in this range. The solid black line is the total of CO and [CI]. The various colored lines captioned directly in the figures indicate the contribution of each CO transition.
Current usage metrics show cumulative count of Article Views (full-text article views including HTML views, PDF and ePub downloads, according to the available data) and Abstracts Views on Vision4Press platform.
Data correspond to usage on the plateform after 2015. The current usage metrics is available 48-96 hours after online publication and is updated daily on week days.
Initial download of the metrics may take a while.