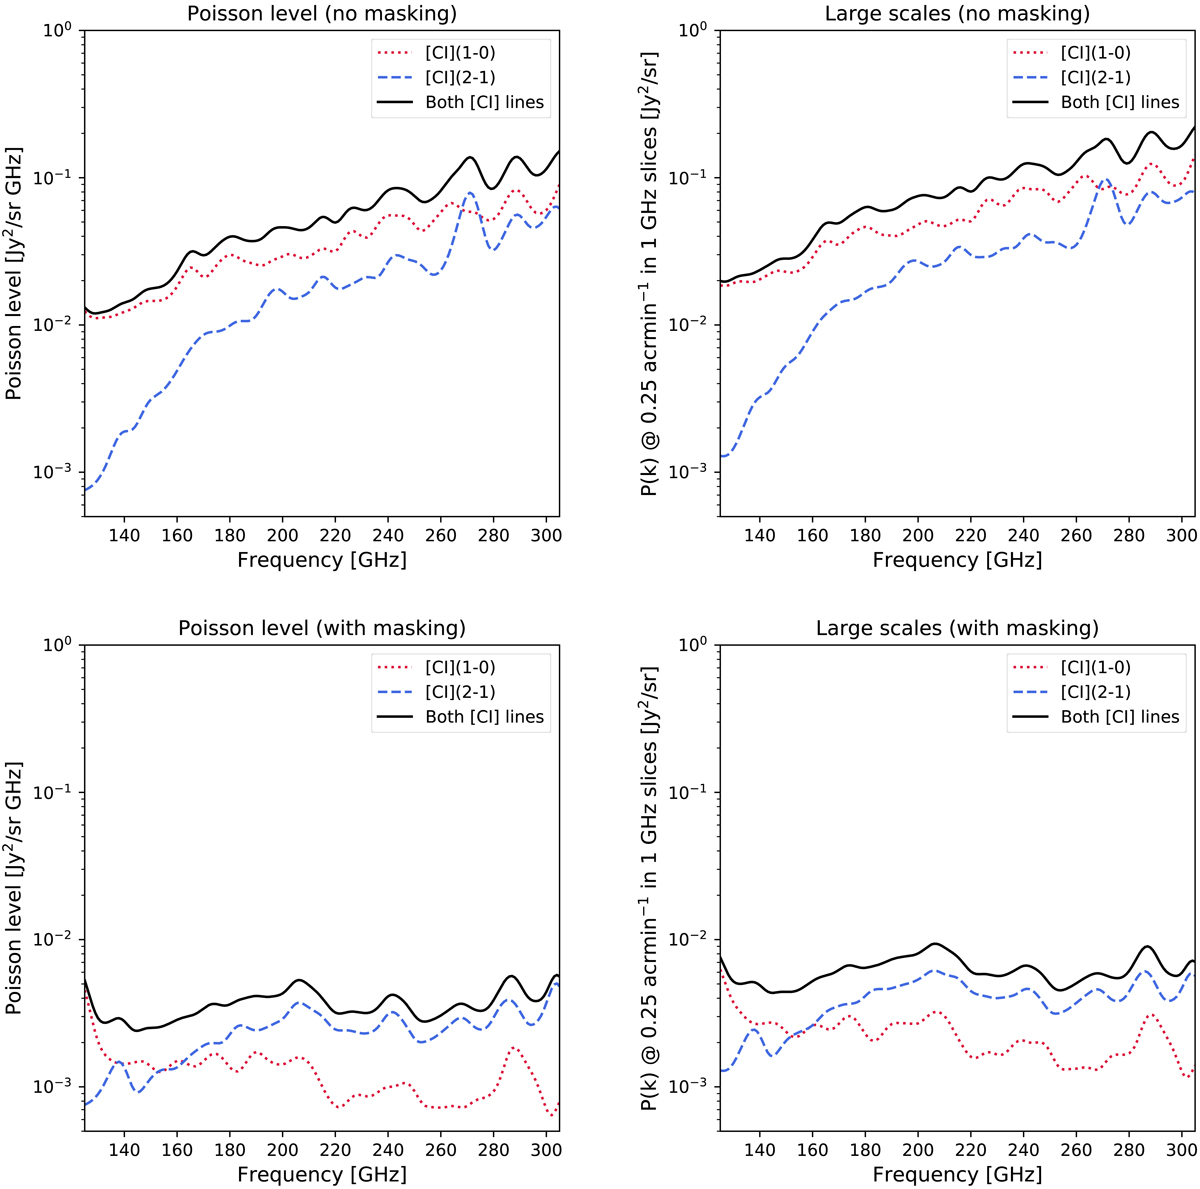
Fig. 17.
Download original image
Contribution of the two [CI] transitions to the Poisson term (left panels) and large-scale power spectrum (right panels) before (upper panels) and after (lower panels) masking the known galaxies from surveys. The solid black line represents the total, while the dotted red line and the dashed blue line correspond to the [CI](1–0) and [CI](2–1) transitions, respectively. For a better visualization, we smoothed the curves by a Gaussian kernel with a σ of 3 GHz.
Current usage metrics show cumulative count of Article Views (full-text article views including HTML views, PDF and ePub downloads, according to the available data) and Abstracts Views on Vision4Press platform.
Data correspond to usage on the plateform after 2015. The current usage metrics is available 48-96 hours after online publication and is updated daily on week days.
Initial download of the metrics may take a while.