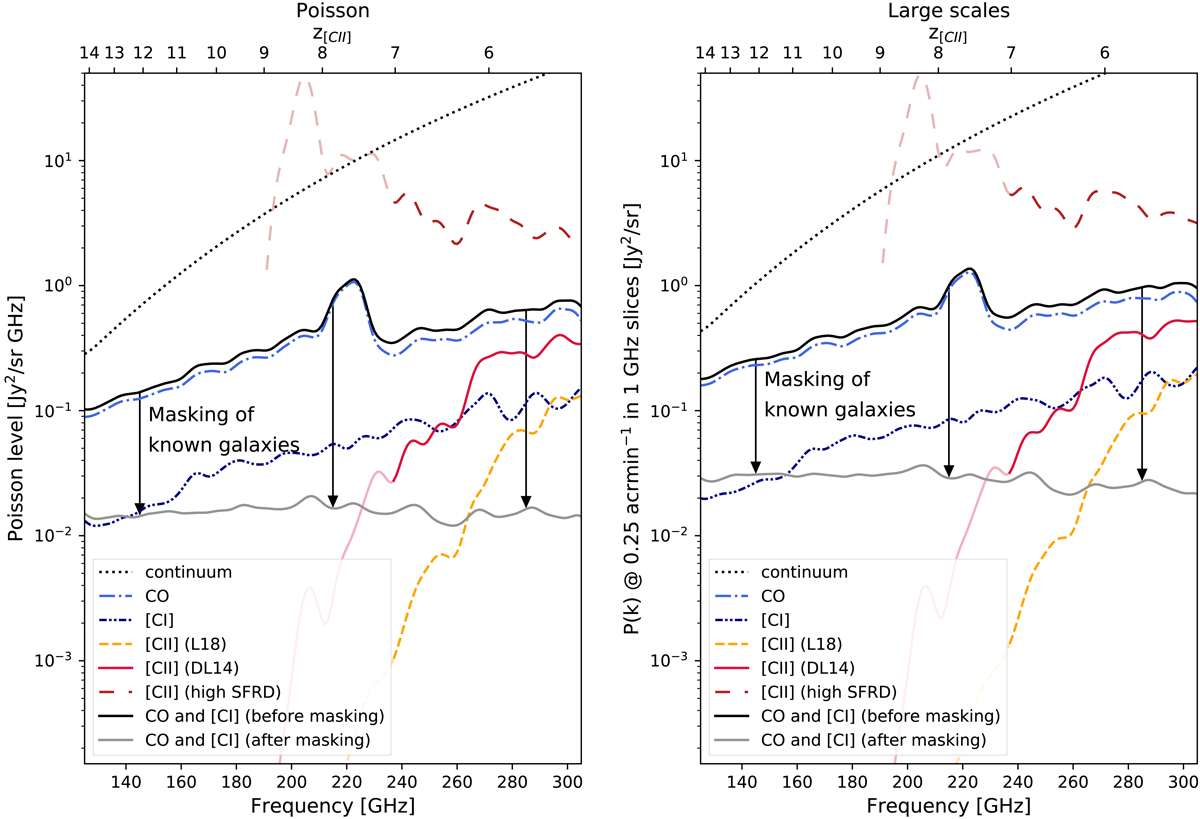
Fig. 15.
Download original image
Level of the power spectrum of the various components in SIDES as a function of the frequency. Left panel: the small scales dominated by the shot noise and the right panel shows the large scales. The dotted black line is the continuum computed using the standard model (low SFRD). The solid red line, the long-dashed brown line, and the short-dashed orange lines are the SIDES predictions for [CII] using the DL18, high-SFRD, and L18 versions, respectively. As discussed in Sect. 4.4, the [CII] power spectra at z > 7 may be underestimated. We thus used a paler color to illustrate it. The dot-dashed light-blue line and the dash-dot-dot dark-blue lines correspond to all the CO and [CI] lines, respectively. The solid black line shows the total contribution of all the CO and [CI] lines, while the solid gray line is the same after masking galaxies known from galaxy surveys (see Sect. 5.4). For a better visualization, we smoothed the curves by a Gaussian kernel with a σ of 3 GHz.
Current usage metrics show cumulative count of Article Views (full-text article views including HTML views, PDF and ePub downloads, according to the available data) and Abstracts Views on Vision4Press platform.
Data correspond to usage on the plateform after 2015. The current usage metrics is available 48-96 hours after online publication and is updated daily on week days.
Initial download of the metrics may take a while.