Fig. 14.
Download original image
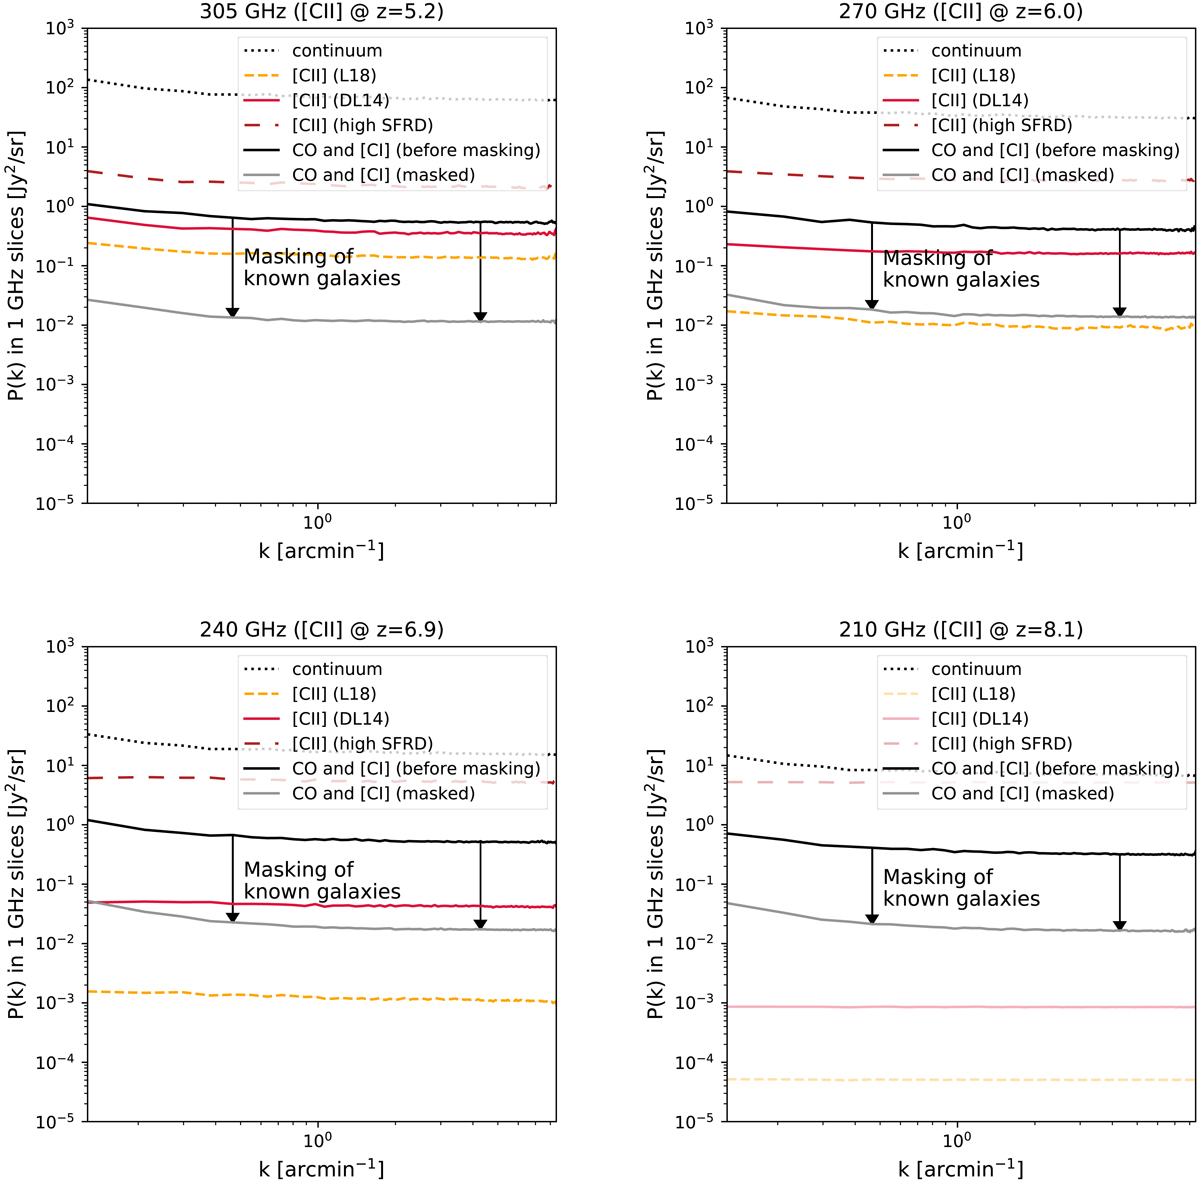
Contribution of the various extragalactic components to the CONCERTO angular power spectra at 305 GHz (upper left panel), 270 GHz (upper right panel), 240 GHz (lower left panel), and 210 GHz (lower right panel) predicted by SIDES. As discussed in Sect. 4.4, the [CII] power spectra at 210 GHz (z = 8.1) could be significantly underestimated by our model. To minimize the effect of the field-to-field variance, we computed the average of the 11 power spectra corresponding to the 1 GHz-wide slices placed between 5 GHz below and above the central slice (except at 305 GHz, for which we have no slice at a higher frequency). The continuum is represented by the dotted line. The solid red lines and the dashed orange lines show the [CII] contribution in SIDES assuming the DL14 and the L18 relations, respectively. The long-dashed brown lines represent the high-SFRD variant of the model (see Sect. 2.7). The black and gray lines show the contribution from both CO and [CI] before and after removing the known galaxies from surveys (see Sect. 5.4).
Current usage metrics show cumulative count of Article Views (full-text article views including HTML views, PDF and ePub downloads, according to the available data) and Abstracts Views on Vision4Press platform.
Data correspond to usage on the plateform after 2015. The current usage metrics is available 48-96 hours after online publication and is updated daily on week days.
Initial download of the metrics may take a while.