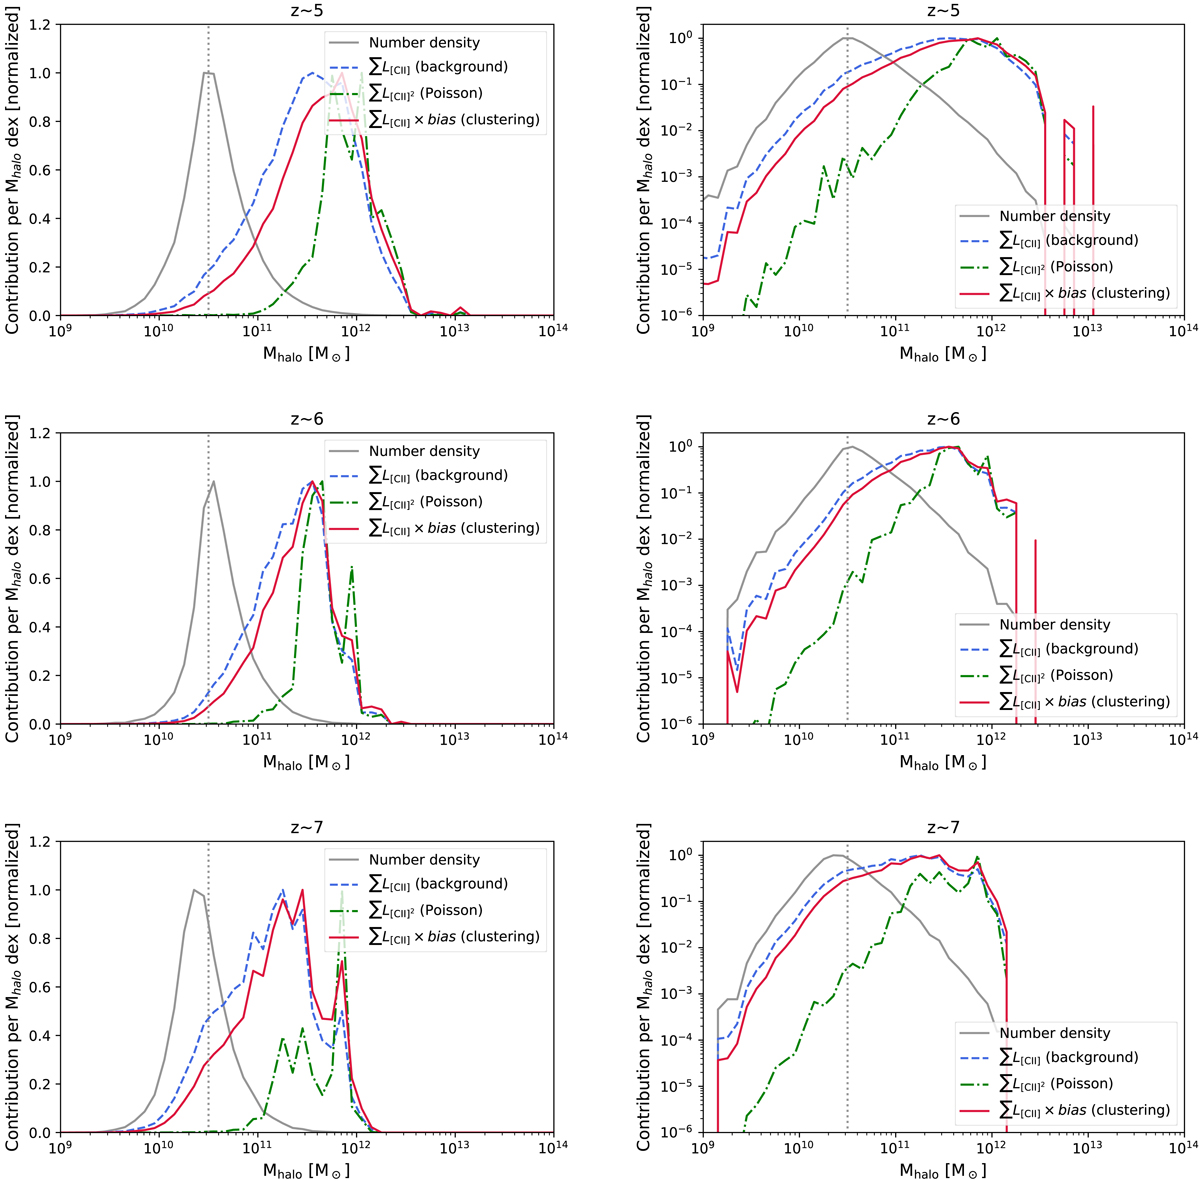
Fig. 13.
Download original image
Effect of the halo mass limit on various [CII] observables (see Sect. 4.4). The curves show the total contribution of galaxies to these observables per logarithmic interval of host halo masses (dex). All the curves are normalized to have their maximum equal to one. Top, central, and bottom panels: correspond to z ∼ 5, z ∼ 6, and z ∼ 7, respectively. Left panels: have a y-axis in linear units, allowing us to naturally visualize the area under the curves, and the right panels are in logarithmic scale to better visualize the behavior at low masses. The gray curve is the number density of the halos and the vertical dotted line shows the halo mass limit of 1010.5 M⊙. The dashed blue line shows the contribution of galaxies to the [CII] background, which is directly derived from the integral of the [CII] line luminosities (see Appendix C). The dot-dashed green line is the contribution to the shot noise, which is directly connected to the integral of the [CII] luminosity squared (see Appendix D). Finally, the solid red curve presents the integral of the luminosity of the galaxies multiplied by the linear bias corresponding to their halo mass. This term is directly connected to the amplitude of the correlated fluctuation of the [CII] background (see Sect. 4.4).
Current usage metrics show cumulative count of Article Views (full-text article views including HTML views, PDF and ePub downloads, according to the available data) and Abstracts Views on Vision4Press platform.
Data correspond to usage on the plateform after 2015. The current usage metrics is available 48-96 hours after online publication and is updated daily on week days.
Initial download of the metrics may take a while.