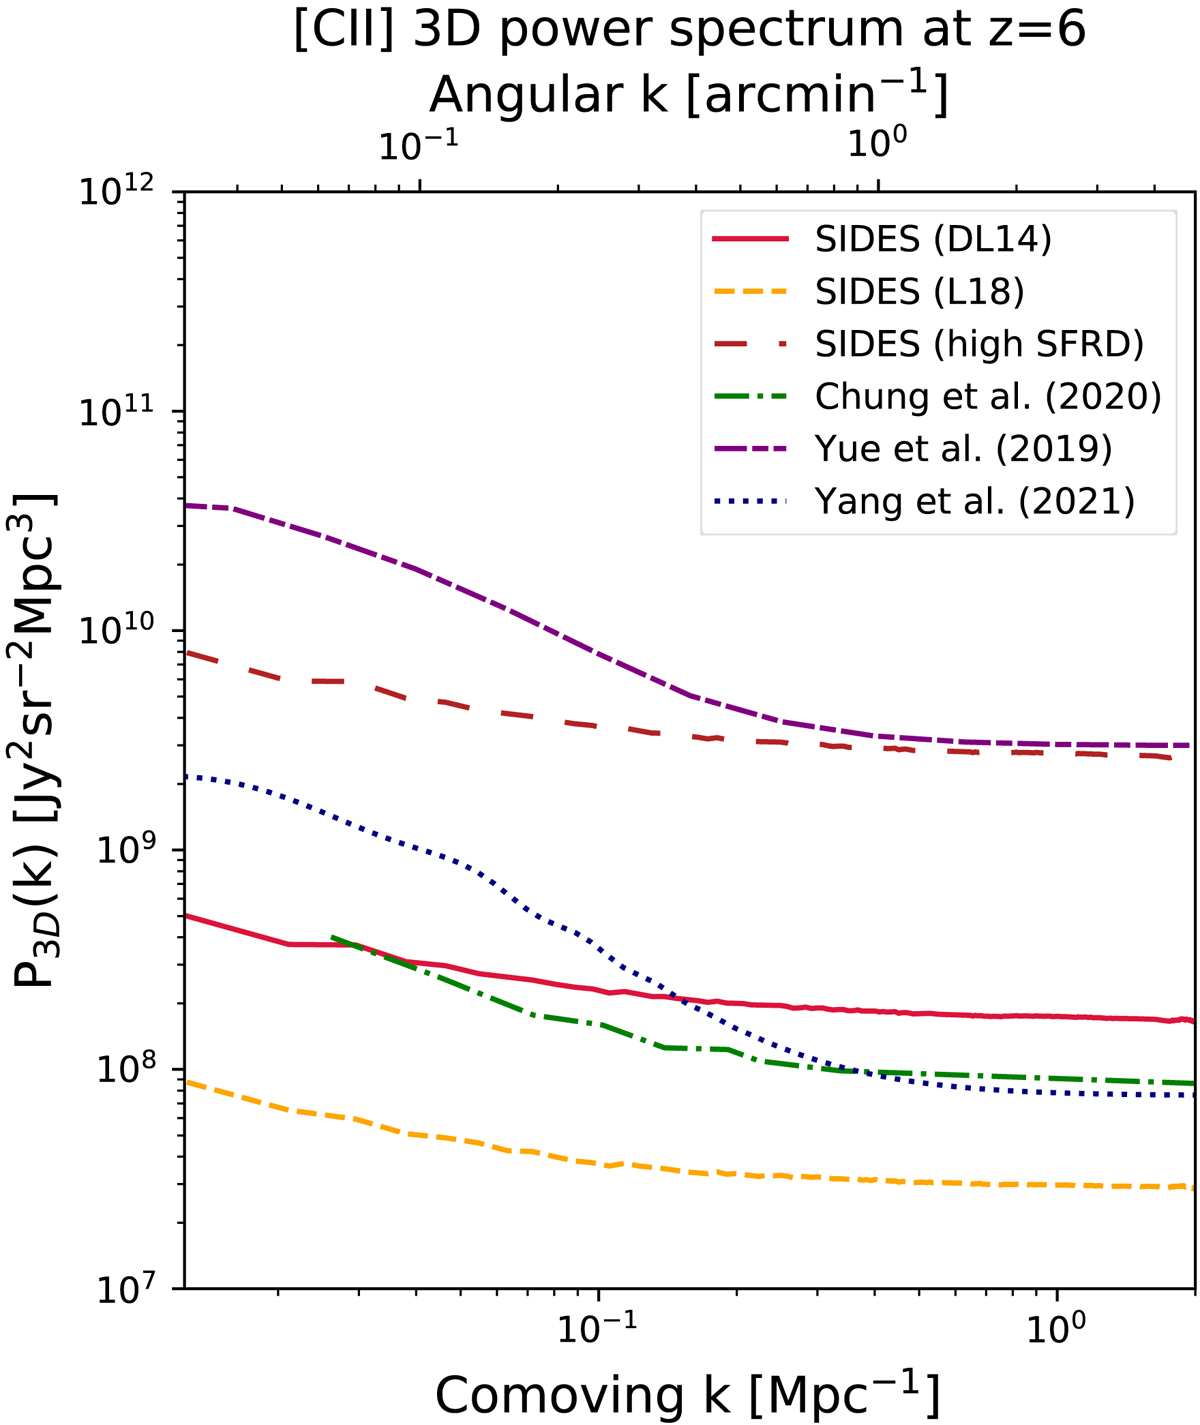
Fig. 12.
Download original image
Comparison of the 3D [CII] power spectra at z = 6 from various models. The lengths are in comoving units. We also indicate the corresponding projected angular wavenumber at z = 6 as the upper x-axis. The x-axis range corresponds approximately to the scales, which will be probed by CONCERTO. The solid red and dashed orange dashed lines are from the SIDES simulation assuming the DL14 and L18 relations, respectively. The long-dashed brown line is the high-SFRD version of SIDES (see Sect. 2.7). We also compare with the models of Yue & Ferrara (2019, two-dot-dashed purple line), Chung et al. (2020, dot-dashed green line), and Yang et al. (2022, dotted blue line).
Current usage metrics show cumulative count of Article Views (full-text article views including HTML views, PDF and ePub downloads, according to the available data) and Abstracts Views on Vision4Press platform.
Data correspond to usage on the plateform after 2015. The current usage metrics is available 48-96 hours after online publication and is updated daily on week days.
Initial download of the metrics may take a while.