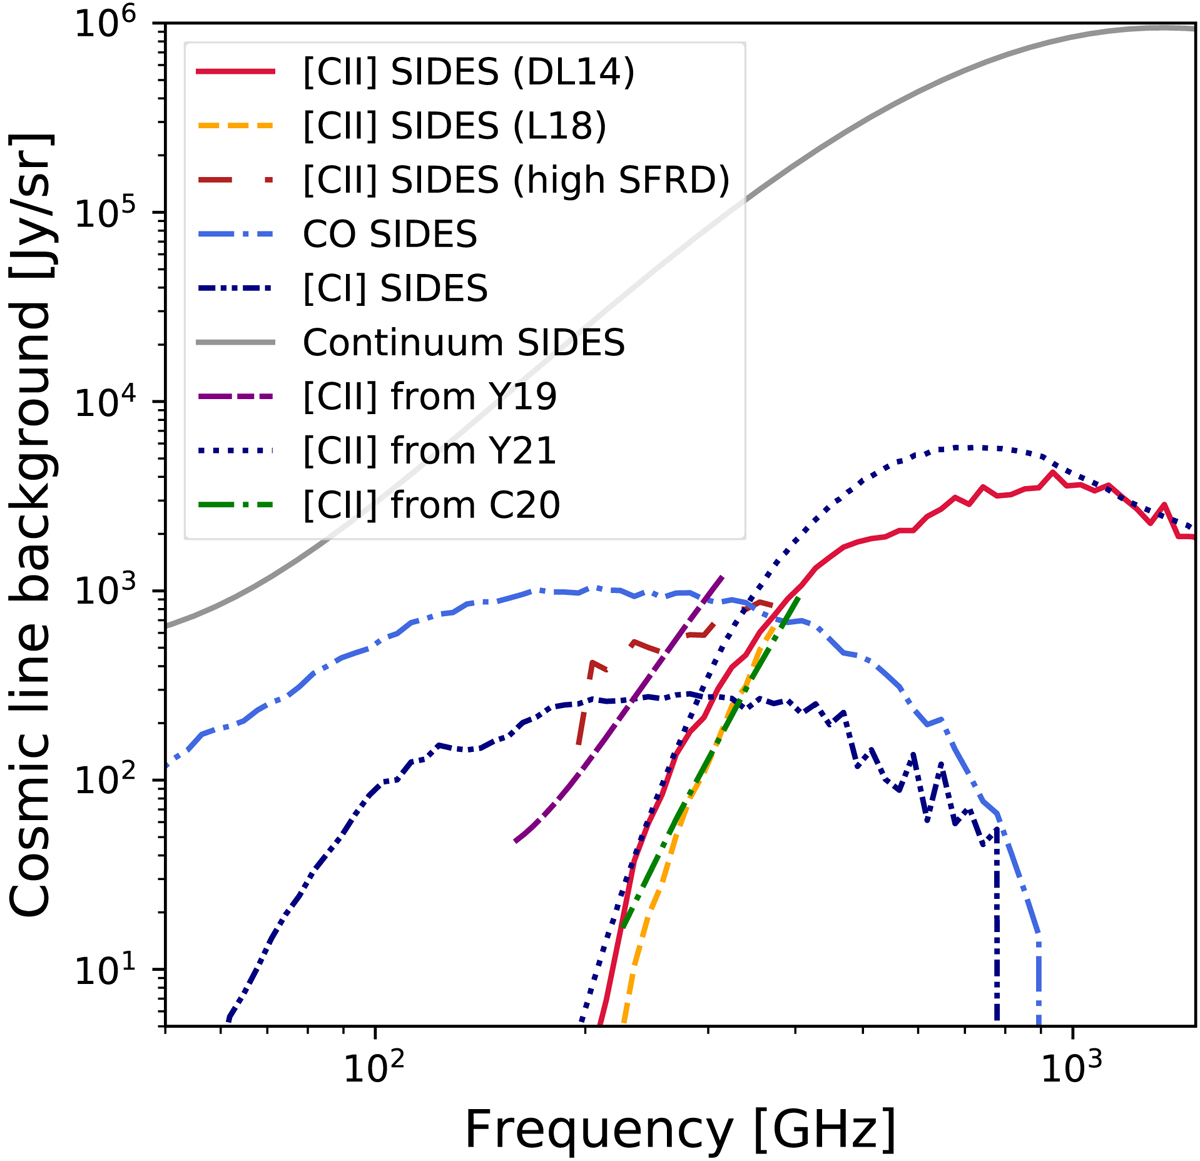
Fig. 11.
Download original image
Cosmic line background as a function of frequency. The solid red line, the dashed yellow line, and the long-dashed brown line, show the predictions of our simulation assuming the DL14 relation, the L18 relation, and the flat z > 4 SFRD (see Sect. 2.7), respectively. The CO, [CI], and continuum background predicted by SIDES are shown as a dot-dashed blue line, a two-dot-dashed dark blue line, and a solid gray line, respectively. The dot-dashed green line, the short-dash-long-dashed purple line, and the dotted blue line are the [CII] forecast from the Chung et al. (2020) model, the Yue & Ferrara (2019) model, and the Yang et al. (2022) model, respectively.
Current usage metrics show cumulative count of Article Views (full-text article views including HTML views, PDF and ePub downloads, according to the available data) and Abstracts Views on Vision4Press platform.
Data correspond to usage on the plateform after 2015. The current usage metrics is available 48-96 hours after online publication and is updated daily on week days.
Initial download of the metrics may take a while.