Fig. 10.
Download original image
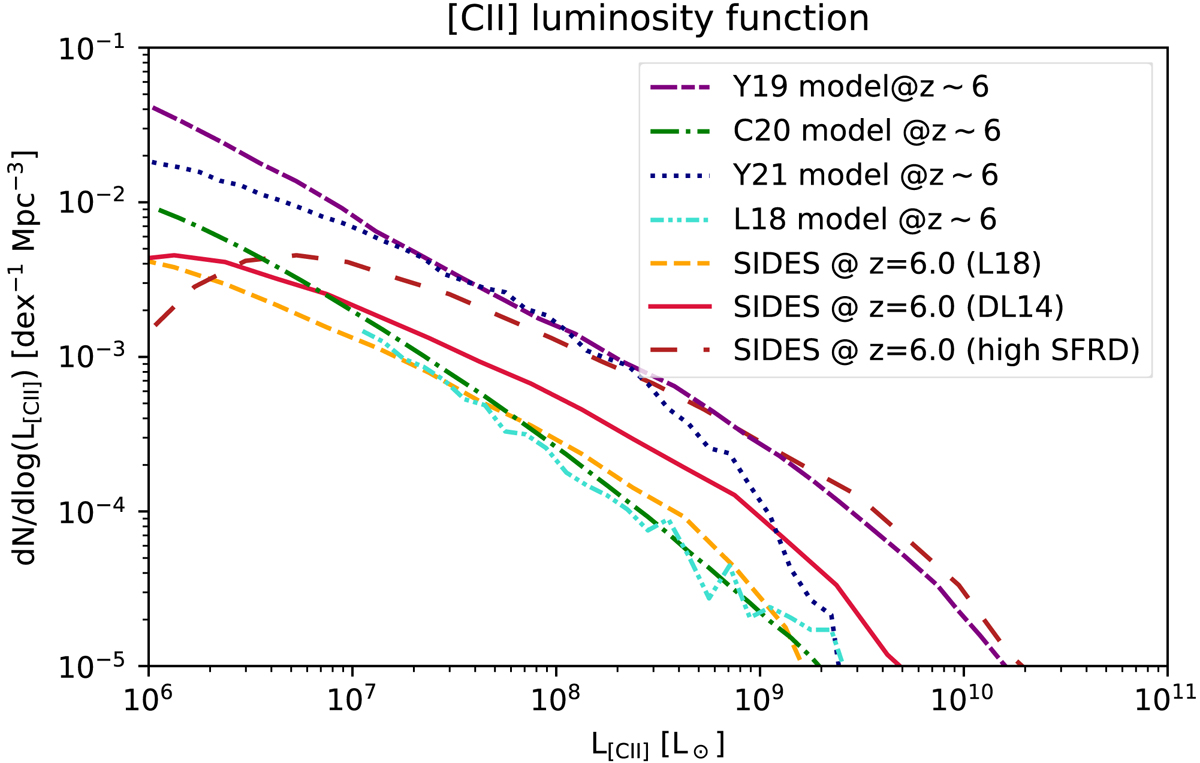
Comparison between the luminosity functions produced by various models at z = 6. The solid red lines and the dashed orange lines represent the SIDES luminosity function using the DL14 or the L18 relation, respectively. The long-dashed brown line is the high SFRD version of SIDES. The models shown for comparison are Lagache et al. (2018, two-dot-dashed turquoise line), Yang et al. (2022, dotted blue line), Yue & Ferrara (2019, short-dash-long-dashed purple line), and Chung et al. (2020, dot-dashed green line).
Current usage metrics show cumulative count of Article Views (full-text article views including HTML views, PDF and ePub downloads, according to the available data) and Abstracts Views on Vision4Press platform.
Data correspond to usage on the plateform after 2015. The current usage metrics is available 48-96 hours after online publication and is updated daily on week days.
Initial download of the metrics may take a while.