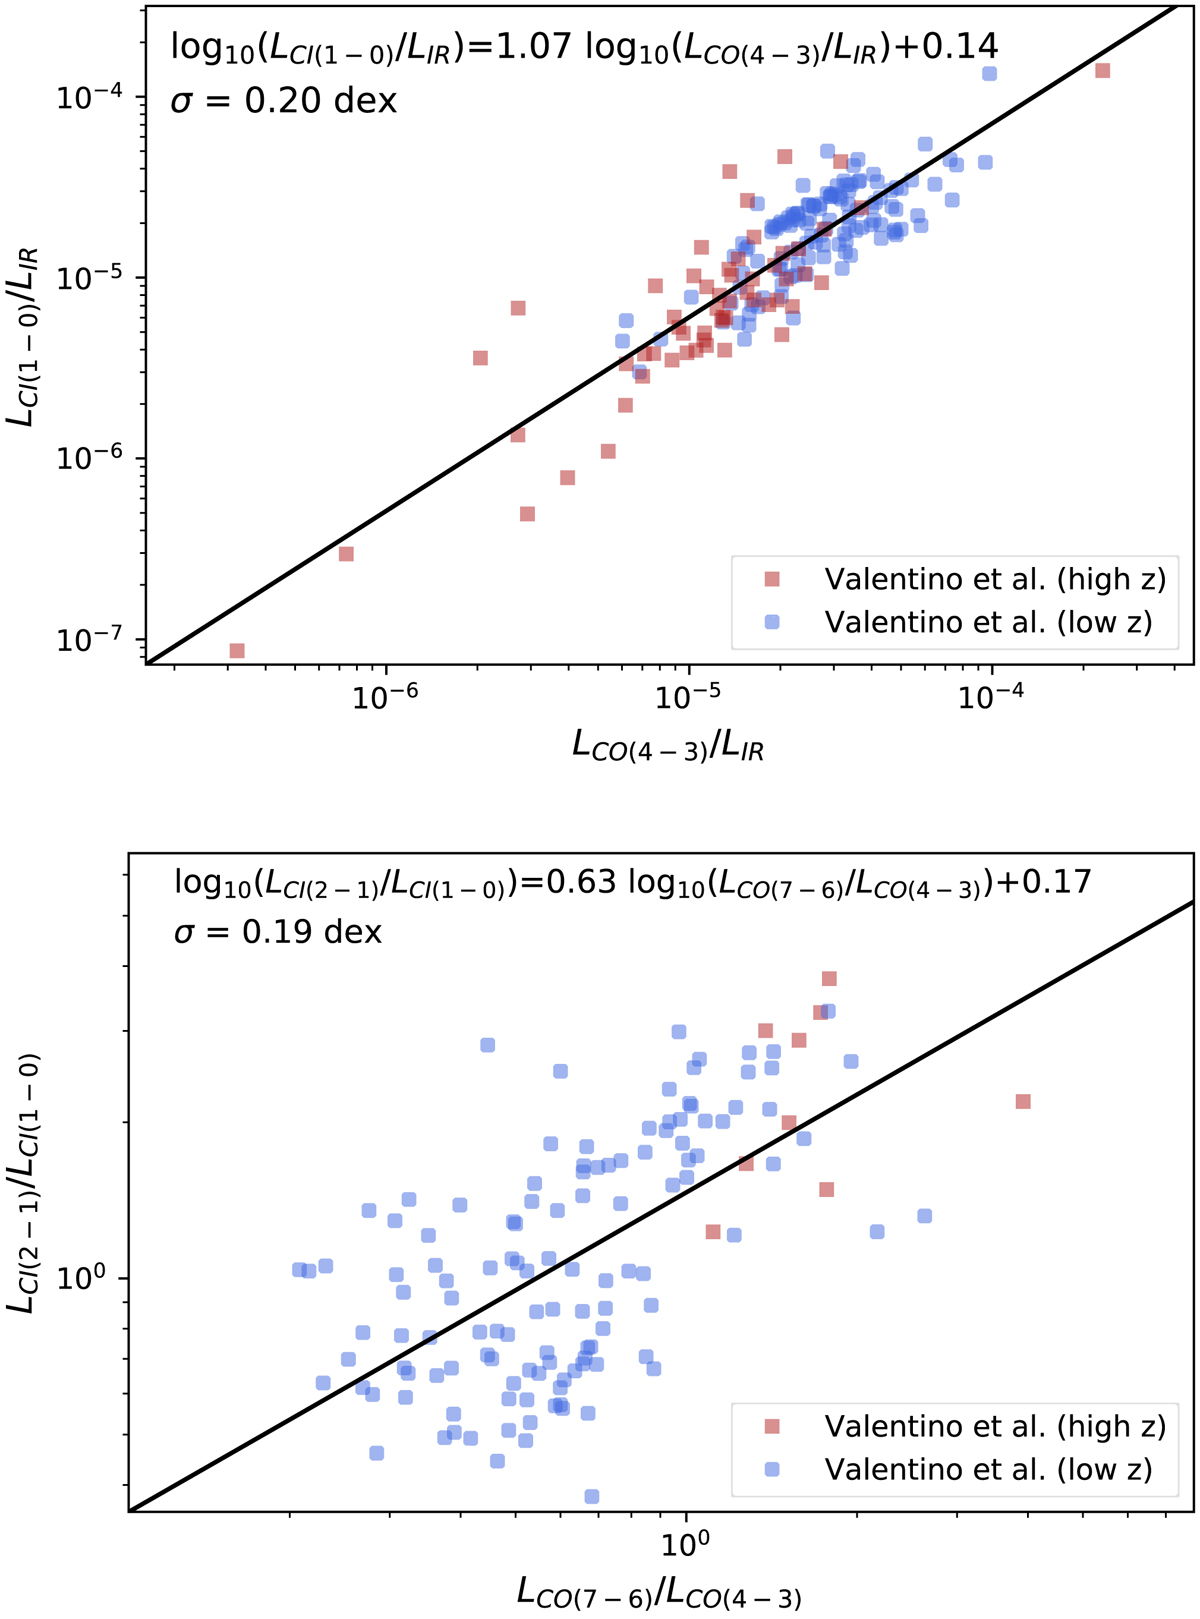
Fig. 1.
Download original image
Empirical relations used to produce the [CI] line fluxes. Upper panel: relation between the L[CI](1 − 0)/LIR and LCO(4 − 3)/LIR ratios. The filled blue circles and the red filled squares are, respectively, the low-z and high-z galaxies compiled by Valentino et al. (2020b). The solid line is our best-fit of this correlation used to generate [CI](1–0) fluxes in our simulation. Lower panel: same figure for the relation between the L[CI](2 − 1)/L[CI](1 − 0) and LCO(7 − 6)/LCO(4 − 3) ratios.
Current usage metrics show cumulative count of Article Views (full-text article views including HTML views, PDF and ePub downloads, according to the available data) and Abstracts Views on Vision4Press platform.
Data correspond to usage on the plateform after 2015. The current usage metrics is available 48-96 hours after online publication and is updated daily on week days.
Initial download of the metrics may take a while.