Open Access
Fig. 7.
Download original image
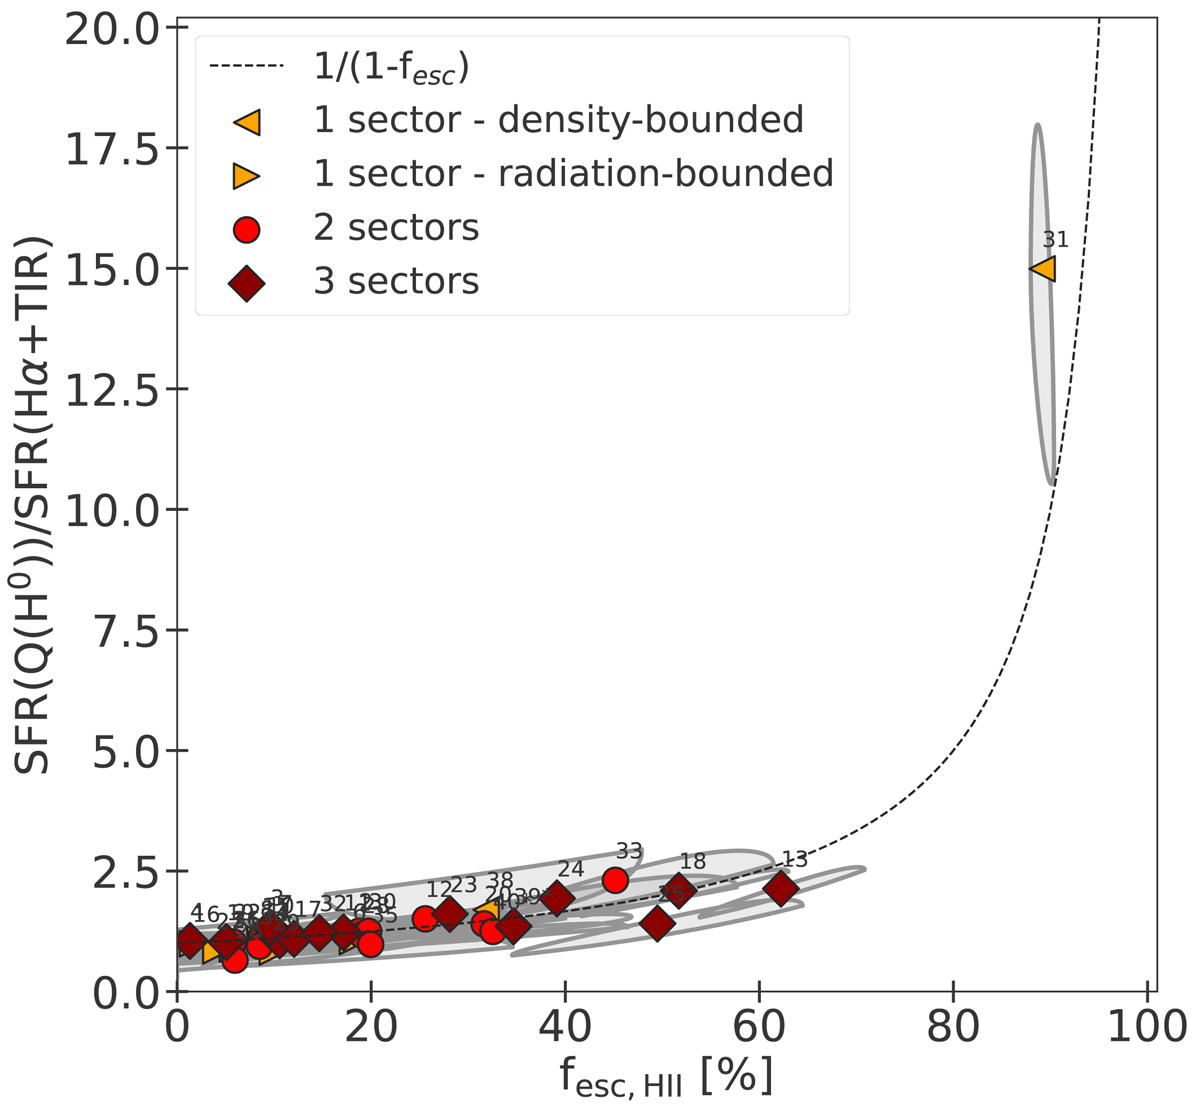
Predicted SFR(Q(H0))/SFR(Hα+TIR) vs fesc, HII. The symbols represent the robust means of the posterior PDF and the gray contours show the 1σ uncertainties of the SUEs. The dashed line corresponds to the analytical curve 1/(1–fesc).
Current usage metrics show cumulative count of Article Views (full-text article views including HTML views, PDF and ePub downloads, according to the available data) and Abstracts Views on Vision4Press platform.
Data correspond to usage on the plateform after 2015. The current usage metrics is available 48-96 hours after online publication and is updated daily on week days.
Initial download of the metrics may take a while.