Fig. 5.
Download original image
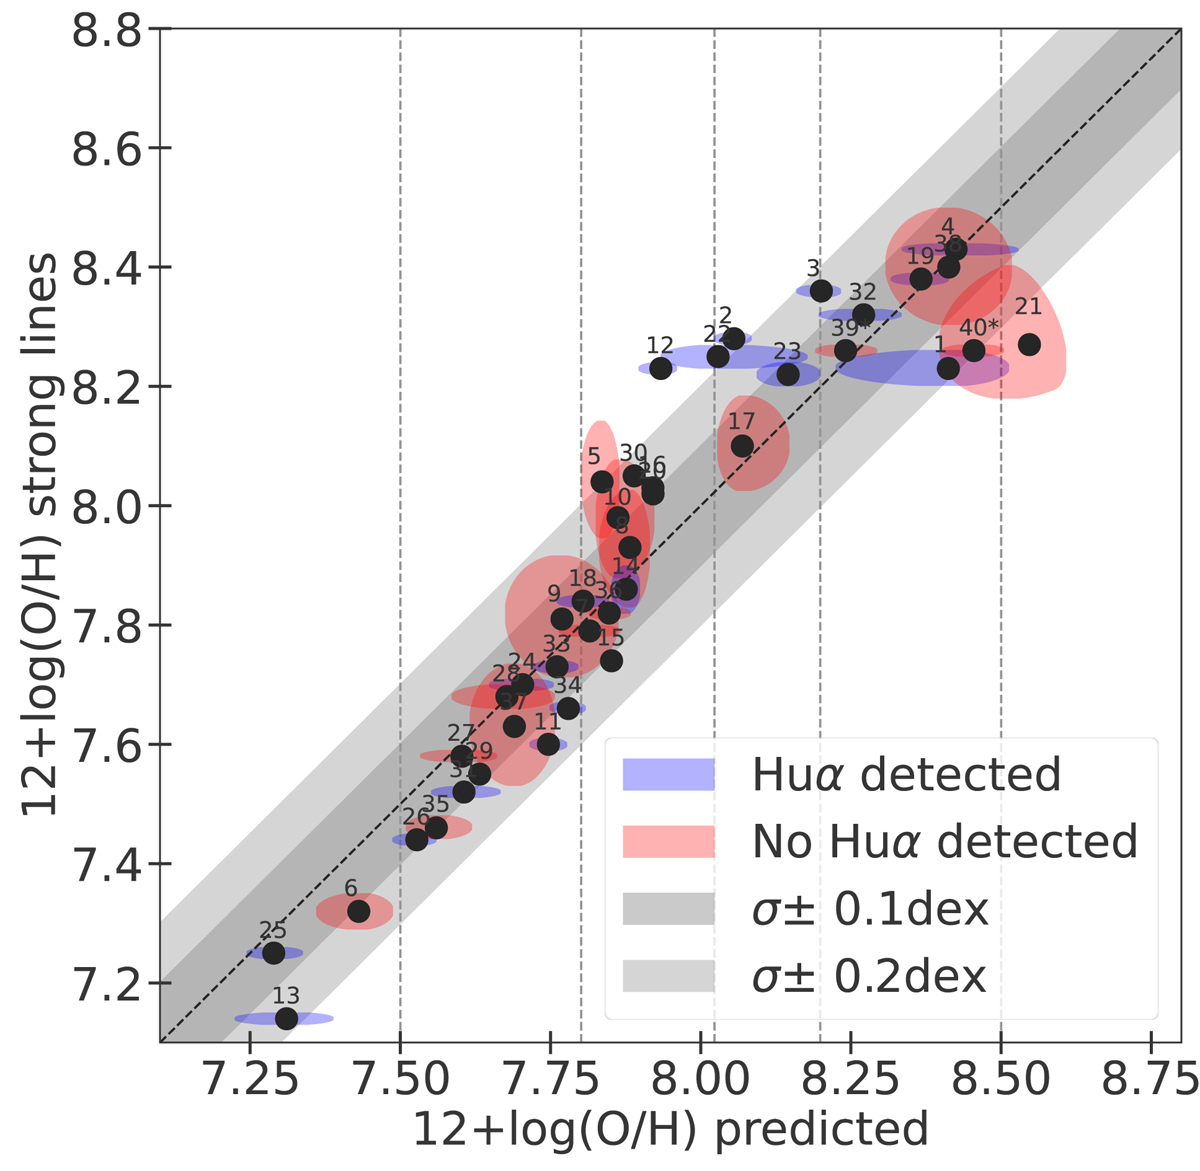
Predicted metallicity of MULTIGRIS vs. measured metallicity from the strong lines R23-P method from Pilyugin & Thuan (2005) based on optical oxygen lines ratio. The black dots represent the robust means of the posterior PDF. The 1σ contours of the SUEs are calculated by simulating mock data for the y-axis with a dispersion corresponding to the measured uncertainty. The vertical dashed lines correspond to the metallicity bins of the grid. The galaxies are labeled with the numbers reported in Table A.1. The numbers that are flagged with a star correspond to two pointings in NGC 4214, which are excluded from the KDE. The color code indicates whether the Humphreys α line (7–6) is detected or not.
Current usage metrics show cumulative count of Article Views (full-text article views including HTML views, PDF and ePub downloads, according to the available data) and Abstracts Views on Vision4Press platform.
Data correspond to usage on the plateform after 2015. The current usage metrics is available 48-96 hours after online publication and is updated daily on week days.
Initial download of the metrics may take a while.