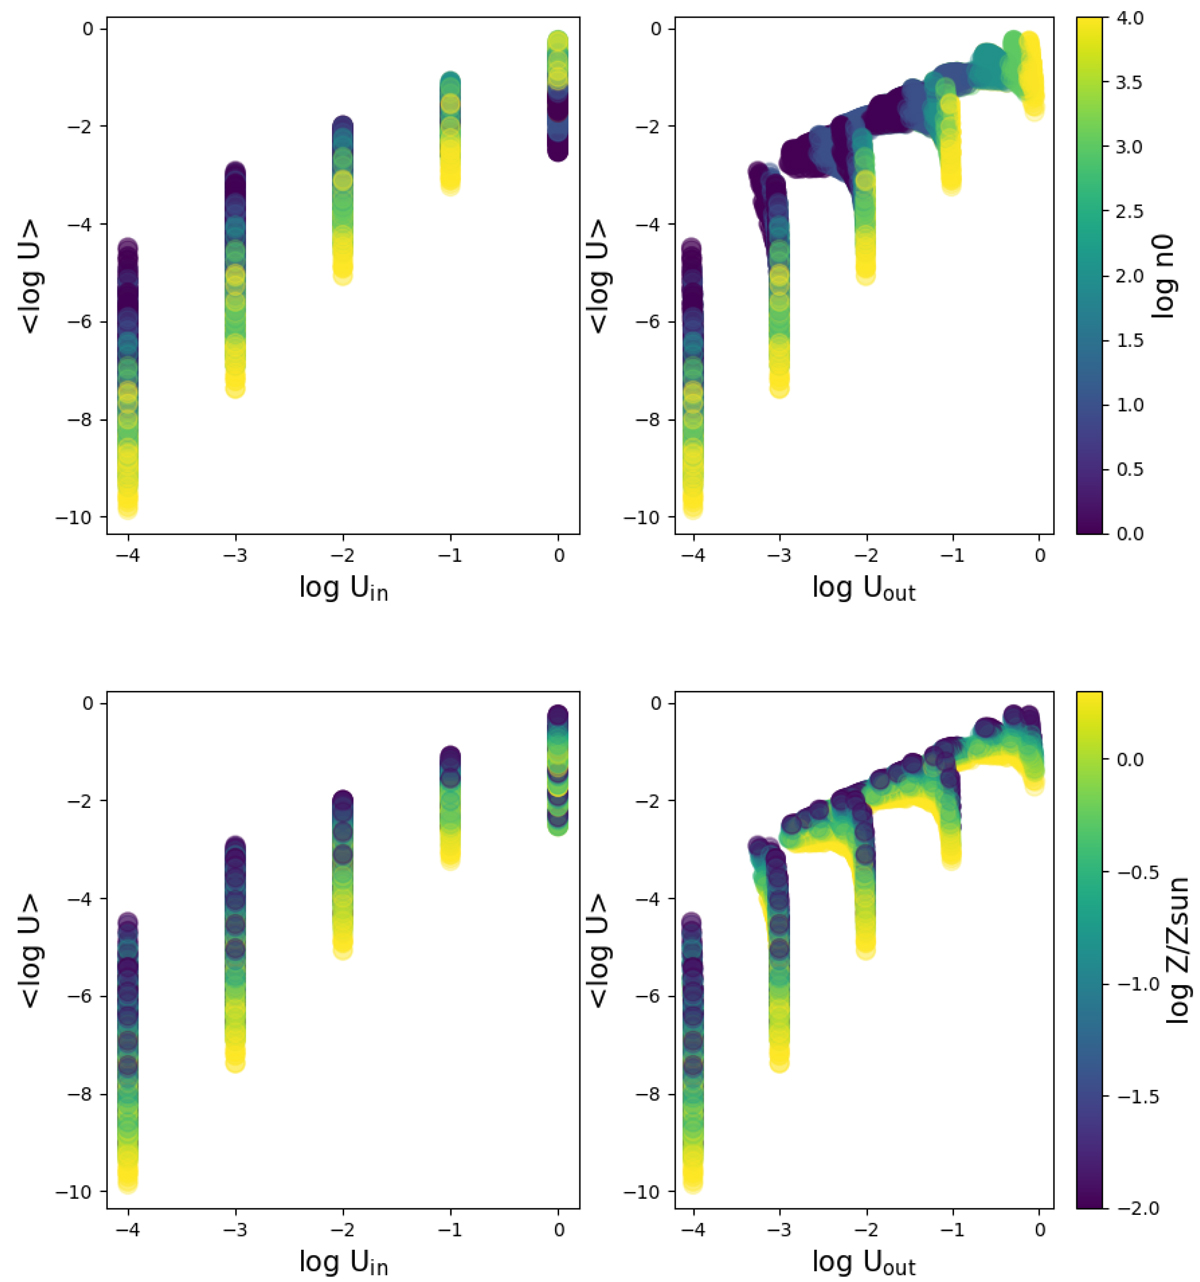
Fig. A.5.
Download original image
Evolution of the volume-averaged ionization parameter log ⟨U⟩ as a function log Uin and log Uout in the model grid. We show only a subsample corresponding to models with no X-ray source and stopping at the ionization front (cut = 1). This figure complements the discussion on the possible caveats induced by the use of Uin as a primary parameter in our grid (see Sect. 3.2.3). We note that Uin only sets an upper limit on the actual volume averaged log ⟨U⟩. Variations in terms of metallicity and initial density n0 yield different geometries, which cover a large range of volume averaged log ⟨U⟩ for the same Uin.
Current usage metrics show cumulative count of Article Views (full-text article views including HTML views, PDF and ePub downloads, according to the available data) and Abstracts Views on Vision4Press platform.
Data correspond to usage on the plateform after 2015. The current usage metrics is available 48-96 hours after online publication and is updated daily on week days.
Initial download of the metrics may take a while.