Fig. 12.
Download original image
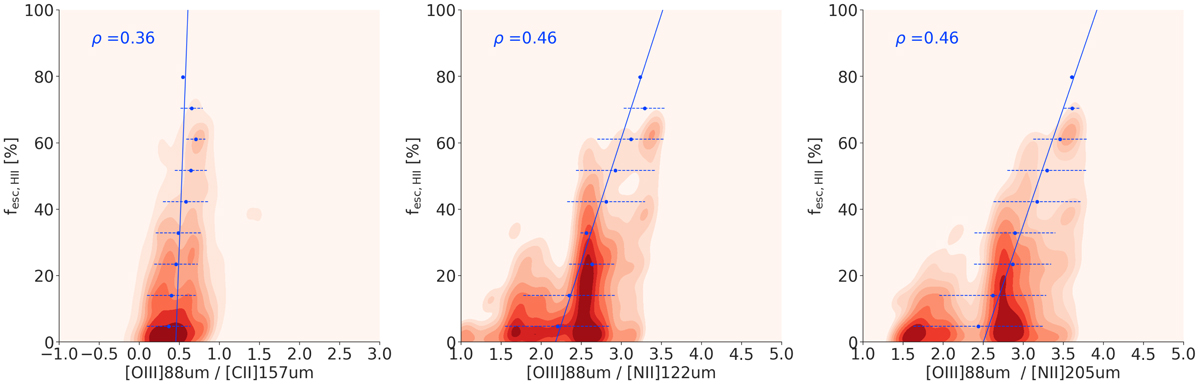
KDE showing fesc, HII as a function of IR ratios. The KDE represent the distribution of all the MCMC draws for galaxies with N ≥ 2 only and ρ the associated Spearman correlation coefficient. For this, we group the MCMC draws for our selected sample by bins of fesc, HII and fit each bin with a gaussian 𝒩(x0, σ2). The blue dots and dashed lines respectively represent the gaussian mean x0 and the gaussian width σ. The plain blue line shows a weighted linear regression applied to the gaussian centers, accounting for the widths of each bin. The corresponding fit values are provided in Table A.2.
Current usage metrics show cumulative count of Article Views (full-text article views including HTML views, PDF and ePub downloads, according to the available data) and Abstracts Views on Vision4Press platform.
Data correspond to usage on the plateform after 2015. The current usage metrics is available 48-96 hours after online publication and is updated daily on week days.
Initial download of the metrics may take a while.