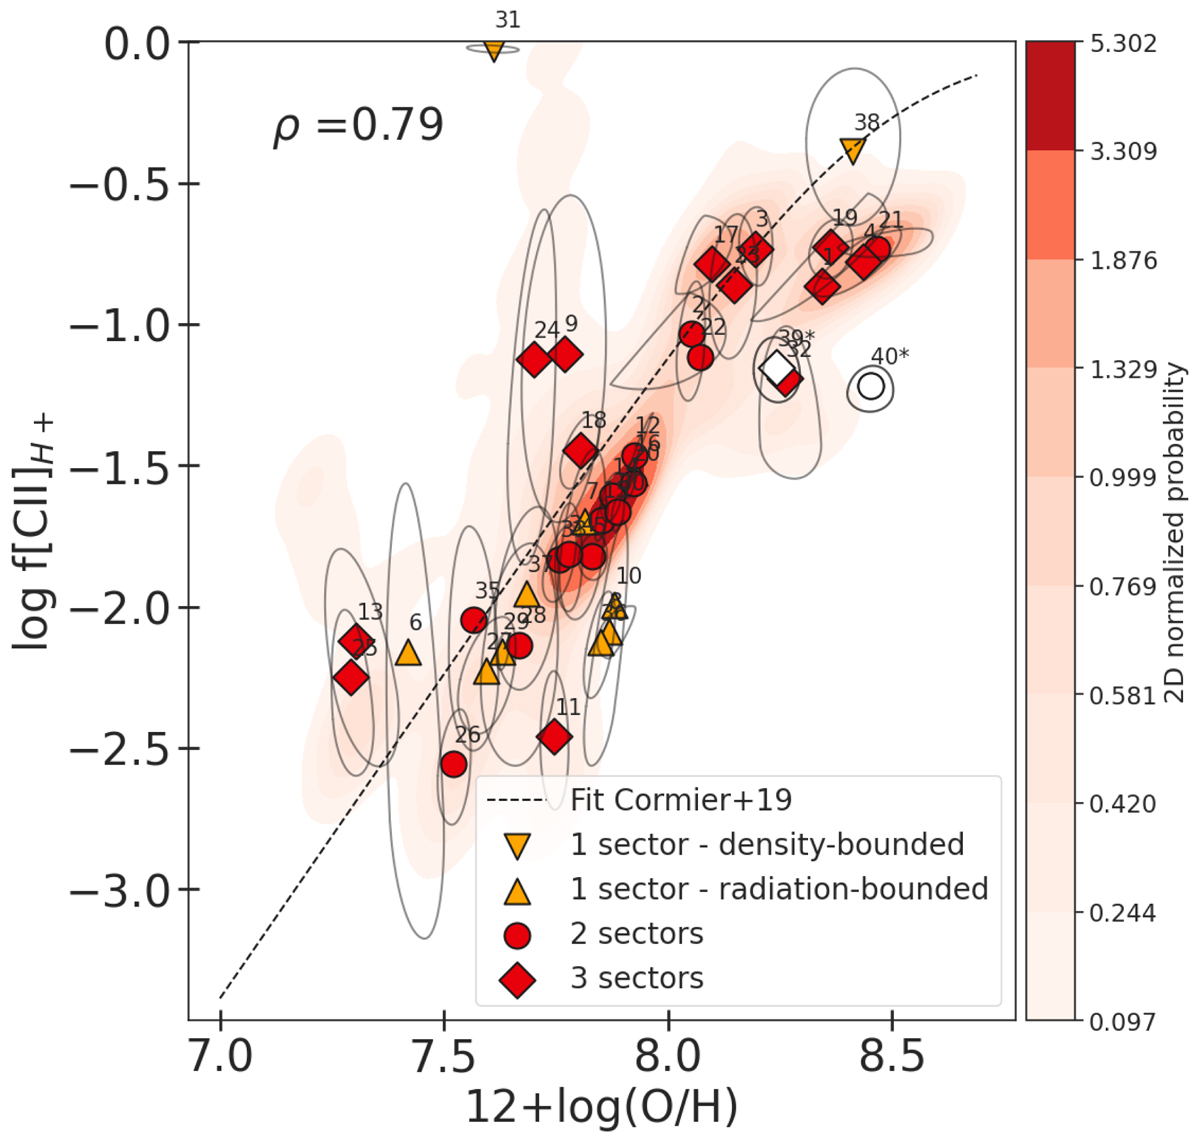
Fig. 11.
Download original image
Fraction of [C II]158 μm in the ionized phase vs. metallicity. The single-sector, density-bounded models represented by orange stars pointing down are PDR-deprived; all their [C II] emission arises from the ionized gas (log f[C II]H+ ∼ 0). The underlying KDE represents the distribution of all the MCMC draws for galaxies with Nsectors ≥ 2 only and ρ the associated Spearman correlation coefficient. The dashed line represents the relation derived by Cormier et al. (2019) for the DGS, assuming a fixed electron density ne = 30 cm−3.
Current usage metrics show cumulative count of Article Views (full-text article views including HTML views, PDF and ePub downloads, according to the available data) and Abstracts Views on Vision4Press platform.
Data correspond to usage on the plateform after 2015. The current usage metrics is available 48-96 hours after online publication and is updated daily on week days.
Initial download of the metrics may take a while.