Fig. 6.
Download original image
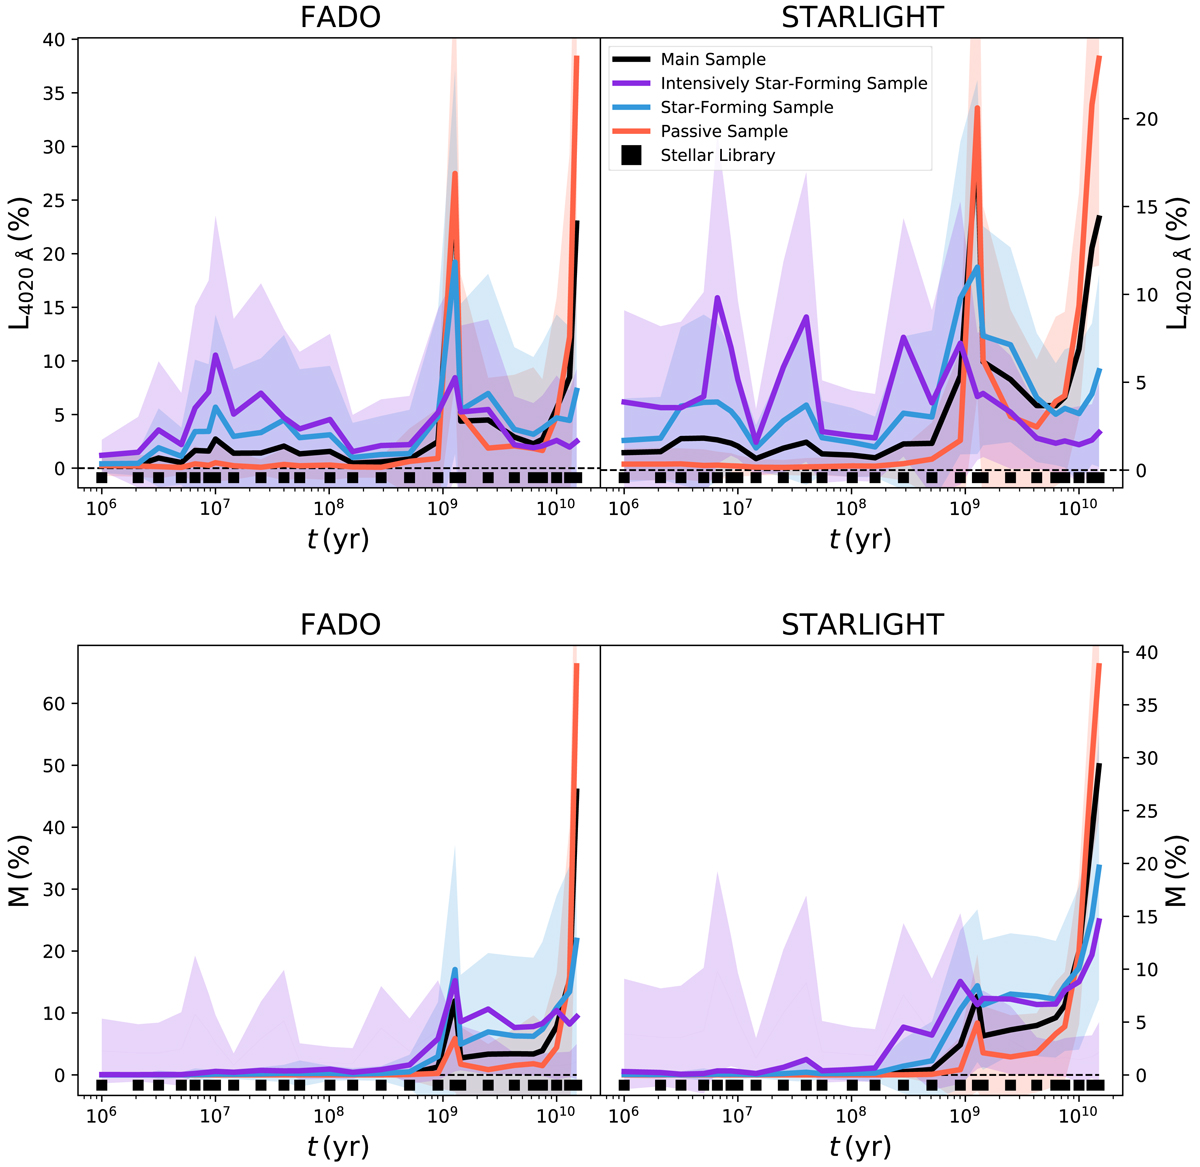
Light (top panels) and mass (bottom panels) relative contributions of the stellar library elements as a function of their age. Black, violet, blue and red lines represent the average results for the MS, ISFS, SFS and PS galaxy populations, respectively, while the surrounding shading denotes their corresponding standard deviation. Black squares represent the age coverage of the adopted stellar library, with the six metallicity values summed at each age step.
Current usage metrics show cumulative count of Article Views (full-text article views including HTML views, PDF and ePub downloads, according to the available data) and Abstracts Views on Vision4Press platform.
Data correspond to usage on the plateform after 2015. The current usage metrics is available 48-96 hours after online publication and is updated daily on week days.
Initial download of the metrics may take a while.