Fig. 5.
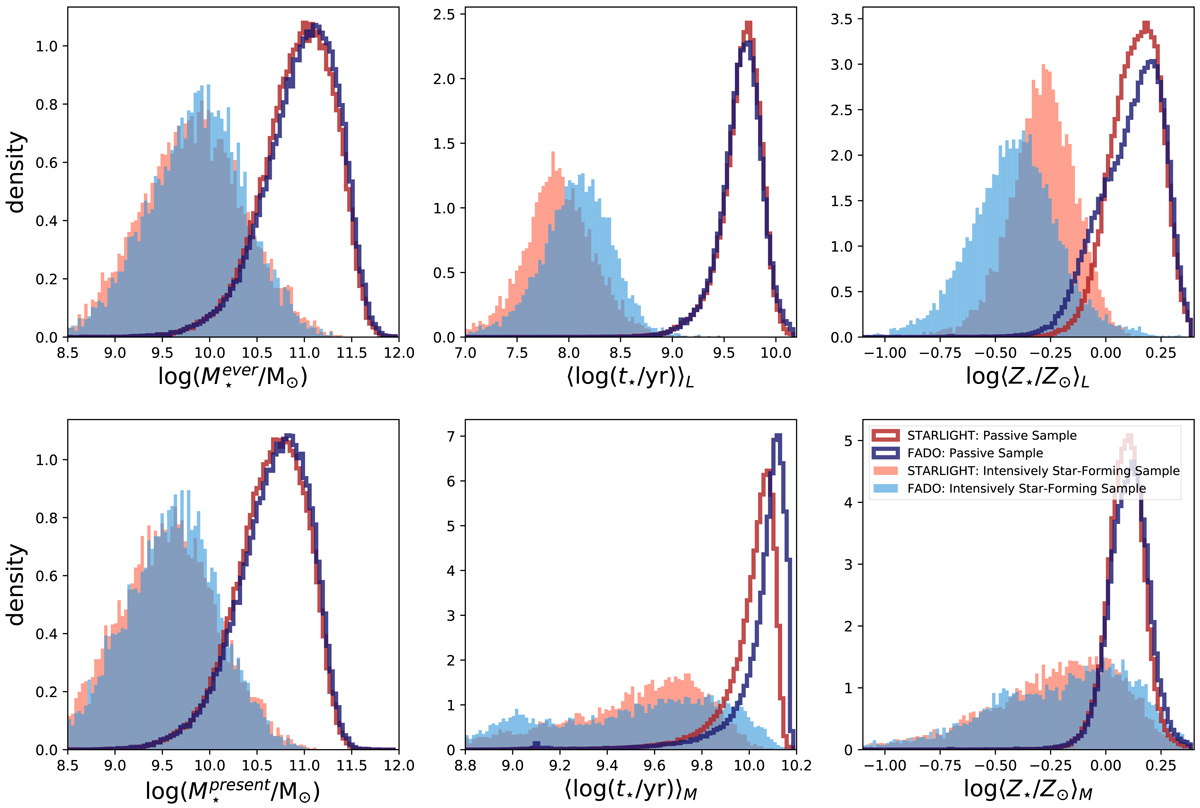
Download original image
Density distributions of the total stellar mass M⋆ in solar units M⊙ (left-hand side panels), mean stellar age ⟨log t⋆⟩ in years (centred panels) and mean stellar metallicity log⟨Z⋆⟩ in solar units (right-hand side panels). Blue and red colours represent results from FADO and STARLIGHT, respectively, for the passive sample (darker colours) and intensively star-forming sample (lighter colours). Other legend details are identical to those in Fig. 4.
Current usage metrics show cumulative count of Article Views (full-text article views including HTML views, PDF and ePub downloads, according to the available data) and Abstracts Views on Vision4Press platform.
Data correspond to usage on the plateform after 2015. The current usage metrics is available 48-96 hours after online publication and is updated daily on week days.
Initial download of the metrics may take a while.