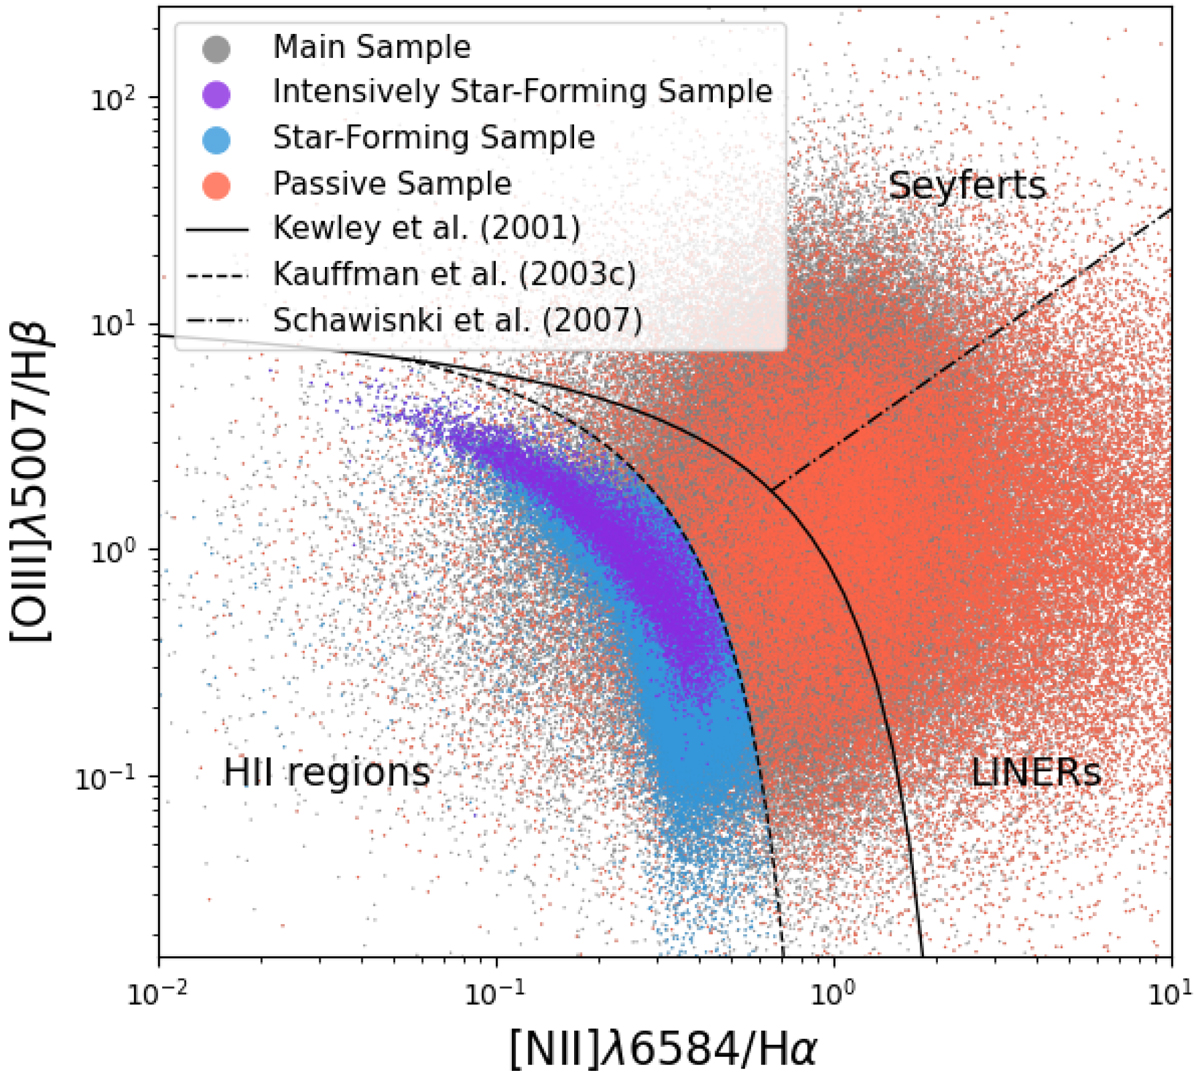
Fig. 3.
Download original image
Emission-line flux ratio [NII]λ6583/Hα as a function of [OIII]λ5007/Hβ. Grey, violet, blue and red points represent the main, intensively star-forming, star-forming and passive samples, respectively. Full, dashed and dot-dashed black lines represent the demarcation lines proposed by Kewley et al. (2001), Kauffmann et al. (2003c) and Schawinski et al. (2007), respectively.
Current usage metrics show cumulative count of Article Views (full-text article views including HTML views, PDF and ePub downloads, according to the available data) and Abstracts Views on Vision4Press platform.
Data correspond to usage on the plateform after 2015. The current usage metrics is available 48-96 hours after online publication and is updated daily on week days.
Initial download of the metrics may take a while.