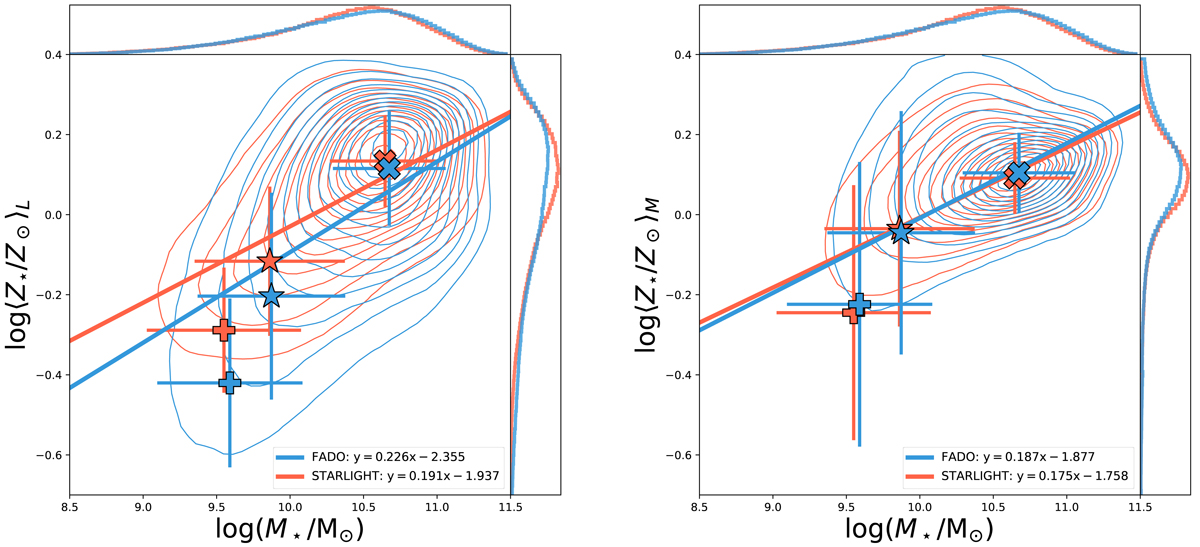
Fig. A.11.
Download original image
Mean stellar metallicity and log⟨Z⋆⟩ as a function of total stellar mass M⋆for the Main Sample. Blue and red lines and points represent FADO and STARLIGHT results, respectively. The ‘✚’, ‘★’ and ‘✖’ symbols represent the average values for the ISFS, SFS and PS populations, respectively, with standard deviation errorbars. Linear regression results for the MS population from each code are present in the legend of each plot.
Current usage metrics show cumulative count of Article Views (full-text article views including HTML views, PDF and ePub downloads, according to the available data) and Abstracts Views on Vision4Press platform.
Data correspond to usage on the plateform after 2015. The current usage metrics is available 48-96 hours after online publication and is updated daily on week days.
Initial download of the metrics may take a while.